The ATOM coin price is preparing to breach another higher resistance of $39.5, suggesting the bull run to continue.
Cosmos employs a proof-of-stake consensus algorithm. Validator nodes with more ATOM tokens are more likely to be chosen to verify transactions and earn rewards. Nodes discovered to be untruthful are penalized and could be held responsible for losing tokens they have.
Let us move ahead to read about the Cosmos technical analysis.
Past Performance of ATOM
In our previous article on Cosmos technical analysis, the coin price gave a decisive breakout from the supply zone near $32-$33. The retest phase gathered sufficient demand, leading the price to higher levels. The price has surged more than 50% in the past week.
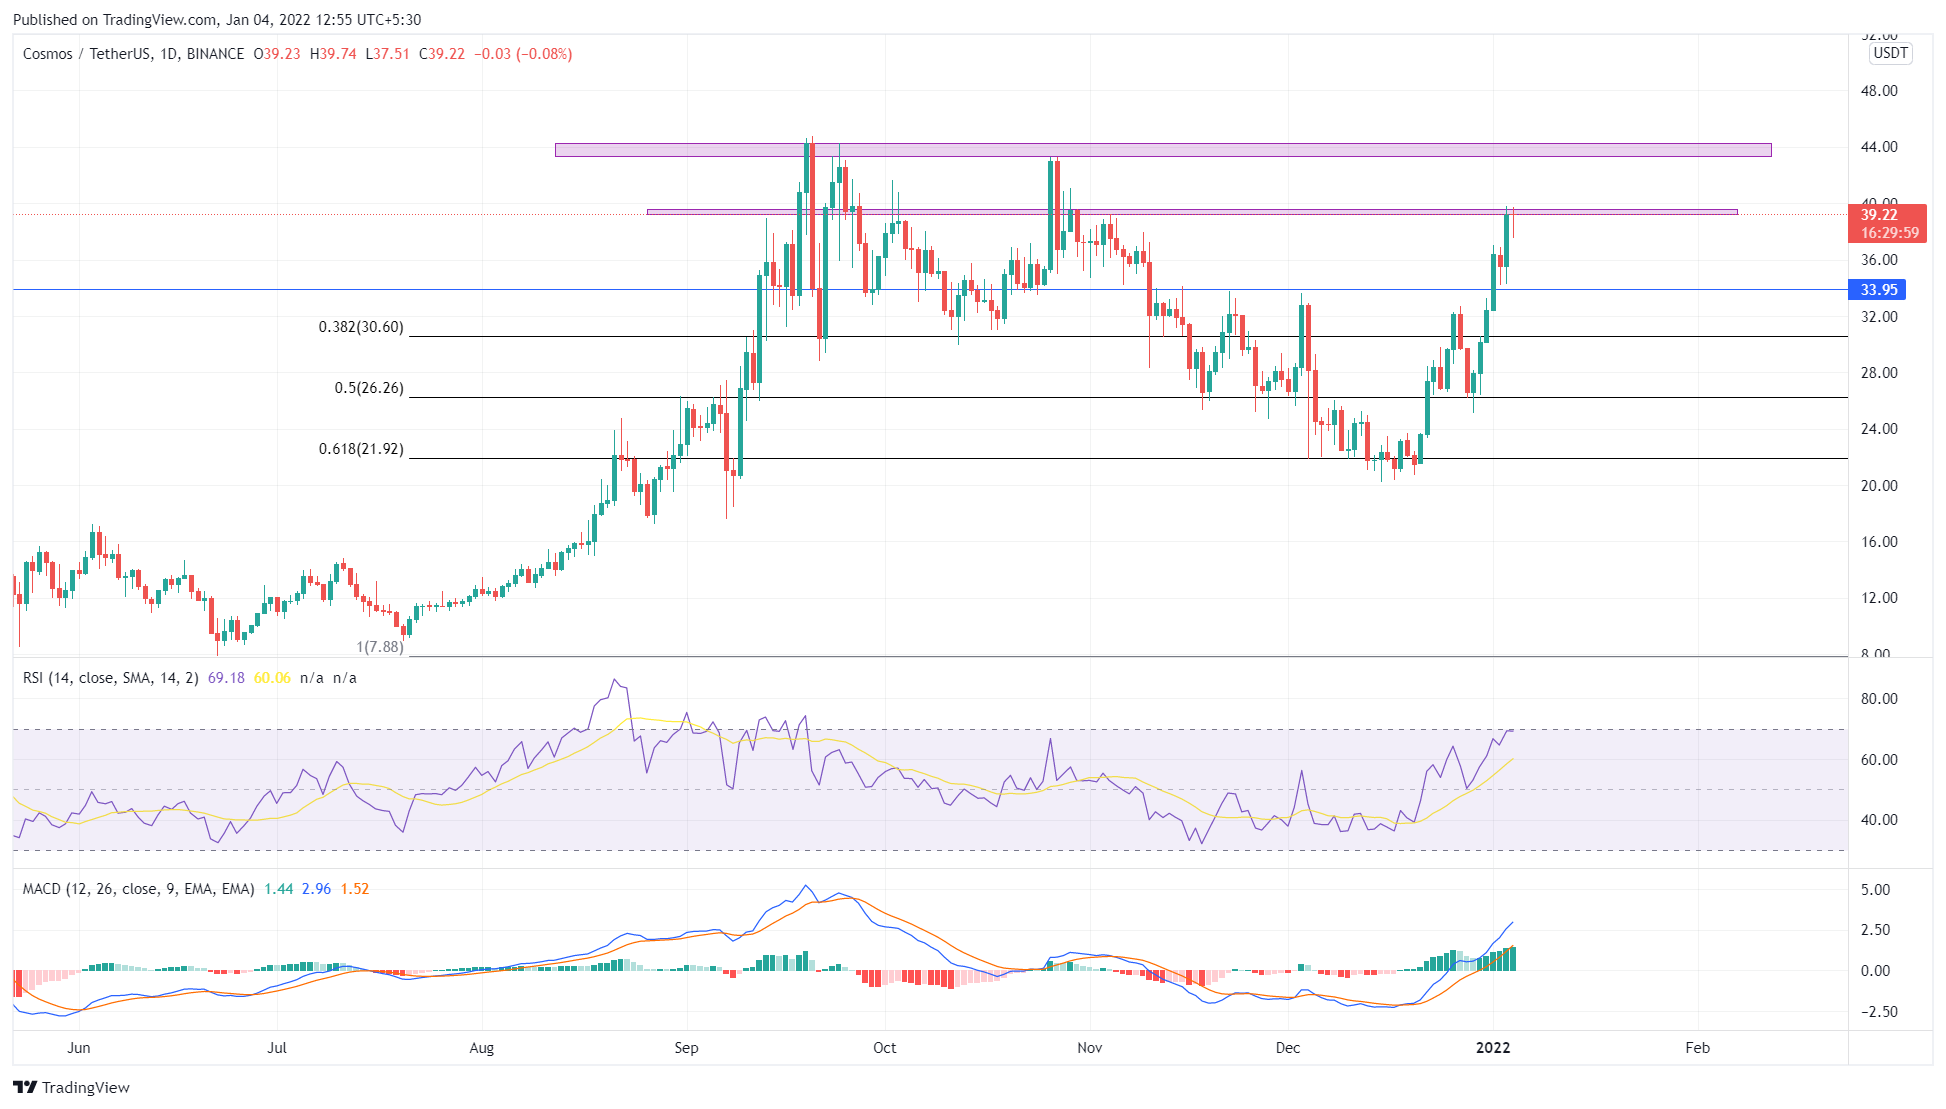 ATOM/USD Daily Chart
ATOM Technical Analysis
The ATOM coin price is near another significant resistance of $39.5, ready to make its breakthrough. However, in case of rejections, the crypto traders can still maintain a bullish sentiment until the price sustains above the $33 support.
The RSI indicator at 69% shows the slope rapidly approaching the overbought zone, supporting the increasing bullishness of the coin. Additionally, there isn't any bearish divergence between the two previous peak levels.
The MACD indicator shows the fast and slow lines widen the gap between them as they rally above the neutral zone. Moreover, the histogram chart confirms the bullish momentum with its rising green bars.
Upcoming Trend
The ATOM coin price action shows a rounding bottom pattern in the daily time frame chart. Following this pattern, the price could reach the $44 neckline. Thus, once the price gives a proper breakout from this overhead resistance, the long traders can expect another entry opportunity that could pump the price to even higher levels.