- Cardano price analysis is bullish.
- Resistance for ADA is found at $1.47.
- Support is present at $1.32.
The Cardano price analysis is bullish today as the coin found support at $1.38 after facing rejection at $1.47 yesterday. The price function has been in the positive direction continuously today as the price levels have reached $1.43. ADA/USD short-term trend line is upwards now, after the coin entered consolidation above $1.20, following a steady decline during the last month.
Overall the broader cryptocurrency market has observed mixed market sentiment over the last 24 hours, but the regime has been on the positive side. However, the gains are minimal, with most coins reporting profits of less than one percent. Sandbox and Enjin Coin are the top gainers with 11 and 13 percent gains, respectively.
ADA/USD 1-day price chart: ADA recovers back to $1.43
The 1-day price chart for Cardano price analysis shows the coin traded in a range of $1.38 to $1.43, and no swing high or low above the said value has been observed. The ADA/USD is trading hands at $1.43 at the time of writing, as the crypto pair reports an increase in value of 0.45 percent over the last 24 hours and reports an increase in value of more than 15 percent over the past week. But despite the price moving up, ADA’s market cap has surprisingly decreased by 0.42 percent, as the trading volume has also decreased by 31 percent as well.
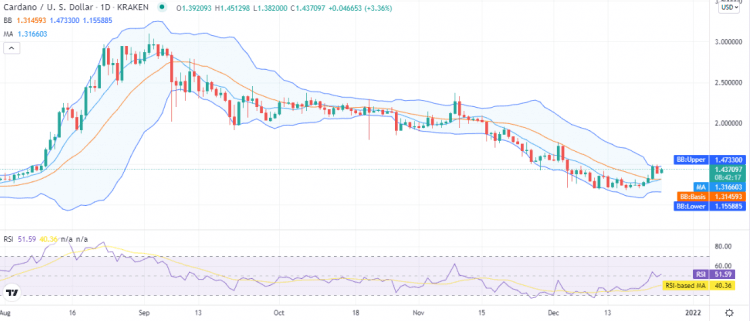
The volatility is comparatively low for ADA, as the Bollinger bands converged sharply on 22nd December. The upper band is at the $1.47 mark, representing resistance for ADA, and the lower band is at the $1.15 mark. The average of Bollinger bands is at $1.31, representing support for the ADA?USD price. The moving average (MA) is at the $1.31 mark. The relative strength index (RSI) is trading in the upper half of the neutral region at index 51. The curve of the RSI is sharply upwards as the price function is coming out of pressure steady manner.
Cardano price analysis: Recent developments and further technical indications
The 4-hour Cardano price analysis shows the price function remained on recovery for the entire time since the start of the trading session. A good omen for the cryptocurrency is the upwards breakout from consolidation, which has paved its way for further improvement in the coming days. After rallying high on 23rd December when the price peaked at $1.47, the RSI shot into the overbought limit on the 4-hour chart, but yesterday ADA corrected, and the RSI also cooled down.
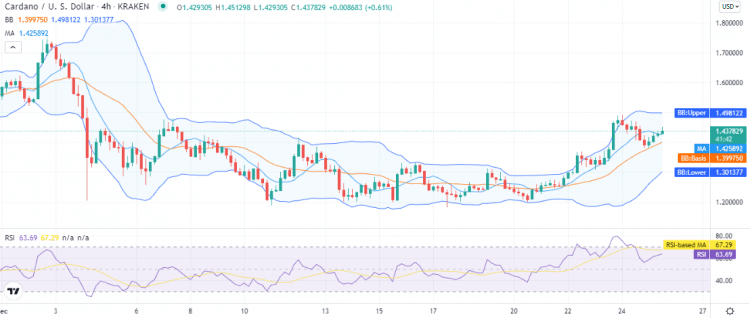
The RSI is now trading at index 63 on an upwards curve as the buying of assets continues in the market. The volatility is still high on the 4-hour chart, but the Bollinger bands are converging here as well; the lower band is shifting upwards at a steep curve, but the upper band is maintaining its level at $1.49. This situation hints at a price to float above the $1.40 range in the coming days.
Cardano price analysis conclusion
The Cardano price analysis shows the coin has started its recovery process as the weekly trend line has shifted in the upwards direction. The coin has successfully broken out of the consolidation in the upwards direction, and we expect ADA to continue upside for at least 12 hours more before correcting again.
Disclaimer. The information provided is not trading advice. Cryptopolitan.com holds no liability for any investments made based on the information provided on this page. We strongly recommend independent research and/or consultation with a qualified professional before making any investment decisions.