- Chainlink price went up more than 5 percent over the past 24 hours
- Trading volume decreased by 24 percent as buyer momentum kicked in
- Price could go as high as 35 percent up to $28 over Christmas period
Chainlink price analysis shows price forming a strong upturn with potential for a 35 percent increase over the Christmas period. Price found a low of $17.92 on December 20, which triggered a buyer influx to stop further movement south. Having moved up more than 5 percent over the last 24 hours, price sits just above $20 at the time of writing. An ascending triangle pattern could be on the cards for the token, taking price as high as $28 where profits maybe targeted.
The larger cryptocurrency market showed mixed results over the last 24 hours, mostly undergoing minor increments. Bitcoin rose up to $49,000, as Ethereum dropped 1 percent to sit just above $4,000. LUNA continued to top the market with a 13 percent increment, taking price as high as $95.03. Polkadot and Ripple also rose 6 percent each, to take price up to $26.06 and $0.952, respectively.
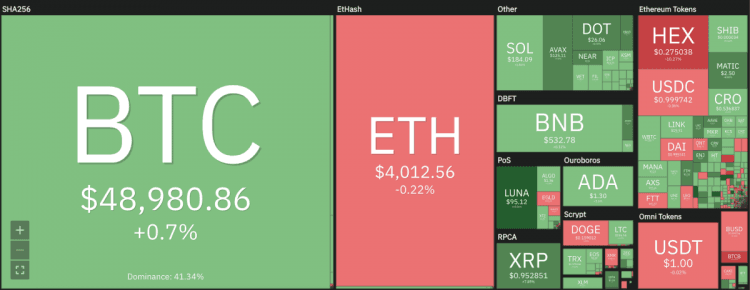
Chainlink price analysis: Cryptocurrency heat map. Source: Coin360
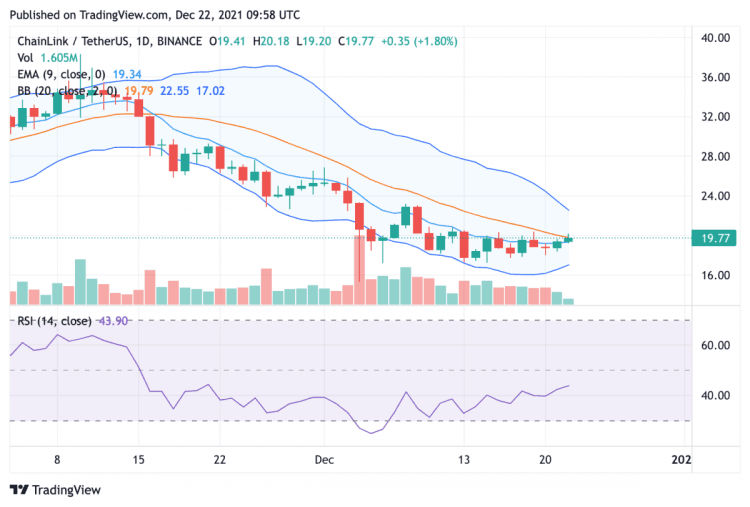
LINK/USD 24-hour chart: Price poised for bullish upturn with rising RSI
The 24-hour chart for Chainlink price analysis shows price aiming upwards with a rising Relative Strength Index (RSI) value of 44.10. Price crossed the crucial 50-day exponential moving average (EMA) over the last 24 hours at $19.31, and will be looking to break into the upper two Bollinger bands’ curves. The current trend will apparently form an ascending triangle to take price upwards of $21 where a buy stop order can be applied, with stop loss at $19.
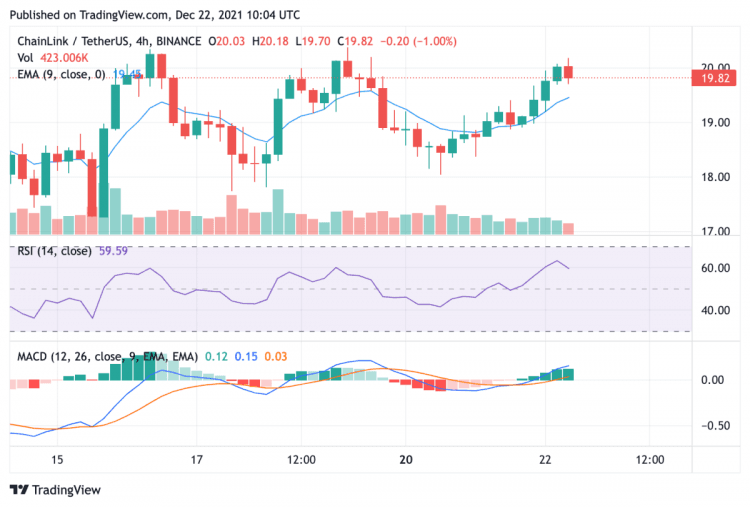
LINK/USD 4-hour chart: Price faces resistance near $21
The 4-hour chart for the LINK/USD trade pair shows price facing resistance near the breakout point of $21. Price moved above the 4-hour EMA over the last trading session and since then has seen some seller action. The RSI value, however shows a healthy valuation in the market for LINK, while the Moving Average Convergence Divergence (MACD) curve also sits above the neutral zone and the 0.00 mark. The next short-term trading sessions could prove crucial in determining price action, where any movement towards the $14 mark could trigger a pullback.
Chainlink price analysis: Conclusion
Chainlink price could be set for a rise of up to 35 percent over the next few days. The $28 mark would be the tip for buyers to reap profits, after an influx carried price upwards after finding bottom at $17.92 2 days ago. At current trend, resistance is found at $21, and a breakout could form at this point on the 4-hour chart. However, any movement below $18.25 could trigger a pullback towards the second support floor of $14.
Disclaimer. The information provided is not trading advice. Cryptopolitan.com holds no liability for any investments made based on the information provided on this page. We strongly recommend independent research and/or consultation with a qualified professional before making any investment decisions.