- Polkadot price analysis is bullish today.
- Resistance for DOT/USD is present at $25.5.
- Support for DOT/USD is present at $23.
The Polkadot price analysis is bullish today as the coin is recovering under high market pressure. DOT/USD is expected to close at a lower high above the $24 mark after the crypto pair set a lower low at $24 yesterday. This was the lowest of the last three months for DOT after 26th August. The next resistance is present at the level of $25.5, where DOT may face some selling pressure.
DOT/USD 1-day price chart: DOT finds support at $24
The 1-day price chart for Polkadot price analysis shows that the coin, after falling to three months low, has found support at $24. How long will this support persist? This will be seen over the next trading session as today bulls have taken some action and initiated a rally upwards. However, the gains may not be of a significant impact as the major trend is bearish, and the trend line for DOT is downwards.
The coin reports only a 1.6 percent increase in value over the last 24 hours, but on the other hand, the coin reports a loss of value amounting to 6.22 percent over the past week, which shows a truer picture of the current market situation. However, the trading volume has improved by 33 percent overnight.
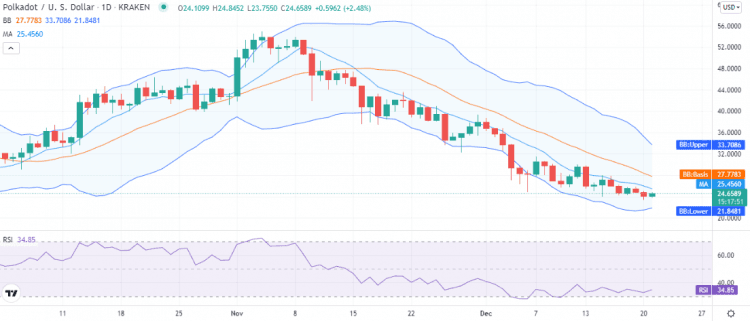
Technically the volatility for DOT/USD pair is high, but it looks like it will decrease in the coming days as the price fluctuations have slowed down and the Bollinger band show signs of convergence. The upper band is present at the $33 mark, and the lower band is present at the $21.8 mark representing support for DOT. The mean average of the indicator at $27.7 represents resistance for DOT/USD pair. The Relative strength index (RSI) is trading at a quite lower level at index 34, but the curve of the indicator is upwards, indicating the current buying activity in the market, but also hints at the price function being under pressure.
Polkadot price analysis: Recent developments and further technical indications
The 4-hour Polkadot price analysis shows the bulls elevated the price steadily during the first four hours of the trading session following a strong correction yesterday. Bears also tried to stop the improvement in price, but bulls took the lead again recently, and the price is moving upwards at the time of writing.
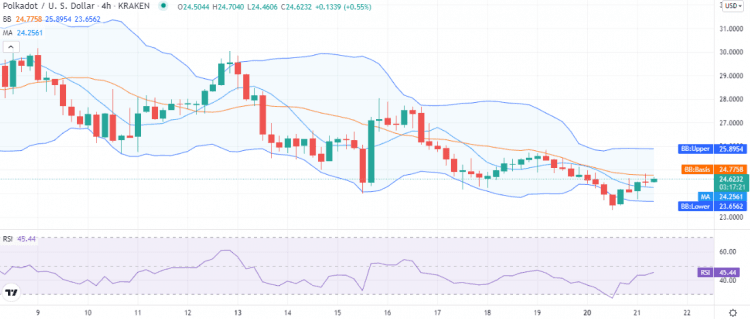
The volatility is comparatively high for DOT on the 4-hour chart, as the Bollinger bands expanded yesterday. The upper band is now at the $25.8 mark, and the lower band is at the $23 mark. The average of Bollinger bands is at $24, representing resistance for the coin. The moving average (MA) is at the $24.2 mark below the price level. The relative strength index (RSI) is trading in the neutral region at index 45; the curve of RSI is upwards, hinting at the bullish activity in the market.
Polkadot price analysis conclusion
The Polkadot price analysis is on the bullish side for today, as the coin has recovered to an extent today. The price has almost reached yesterday’s starting level, which acts as a resistance now, so DOT may retrace a bit before breaking through this resistance. However, we expect DOT to continue upside above the $24 level for today if the bullish momentum continues.
Disclaimer. The information provided is not trading advice. Cryptopolitan.com holds no liability for any investments made based on the information provided on this page. We strongly recommend independent research and/or consultation with a qualified professional before making any investment decisions.