- The Algorand price analysis is bearish today.
- Support for ALGO is present at $1.21.
- The resistance is found at $1.38.
The latest Algorand price analysis is bearish, as the price underwent a substantial decline in the last 24-hours. Bearish pressure has been immense today as the price has been degraded steeply. If we analyze the market situation from a general overview, the past few weeks have proved to be highly detrimental for cryptocurrencies. A constant downtrend has been on the rise, and a similar trend has been observed even today. On the other hand, the current situation has provided opportunities to the buyers waiting for a lower price to buy the dip.
ALGO/USD 1-day price chart: Price stoops to three months low
The one-day Algorand price analysis shows the price has stepped down to a three months lowest level, as the ALGO/USD value is going through a drop. The coin is trading hands at $1.27 at the time of writing, which is a relatively lower level compared to the average price a month back. A considerable degree of downfall in coin value is being detected due to rising bearish pressure. If the bearish pressure persists, it can be predicted that the price will decrease further in the next few days.
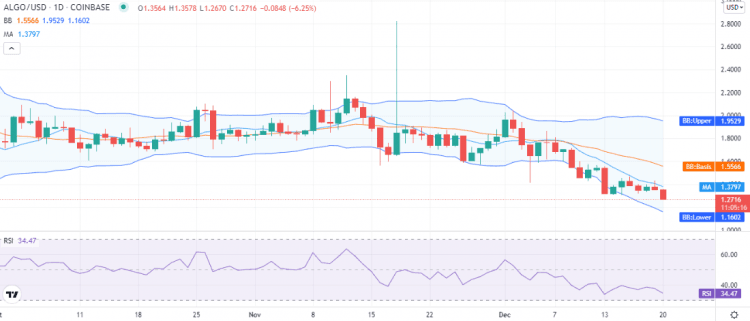
The moving average (MA) has also traveled low towards the price level as it trades at $1.37.The volatility is increasing at a high pace as the Bollinger bands are expanding because of the continuous downward trend. The upper limit of the Bollinger Bands is now at the $1.95 level, whereas its lower limit is standing at $1.16 level representing support. The Relative Strength Index (RSI) score has gone below near the undersold region as the score has decreased to index 34, and the downwards curve of the indicator indicates the selling pressure in the market.
Algorand price analysis: Recent developments and further technical indications
The 4-hour Algorand price analysis also shows a downtrend as the bears have been leading the price function for the past 28 hours. No presence of bullish elements has been detected at any time of the day, as the downtrend has resulted in price devaluation up to the $1.27 level.
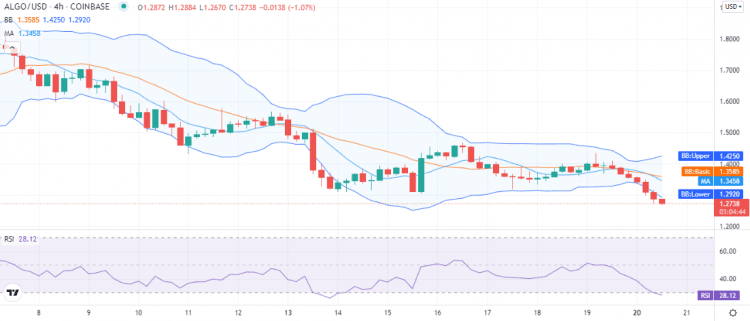
The moving average is trading currently at the $1.34 level, and The Bollinger bands average has moved down to $1.35 because of the constant decreasing trend. The volatility is again on the rise on the 4-hour chart as the upper limit of Bollinger Bands Indicator is now touching the $1.42 mark, and the lower band is touching the $1.29 mark. The worrisome sign is the price has traveled below the lower band, which has turned into a resistance level now. The RSI curve has entered the undersold region as it is trading at index 28. The RSI shows the coin is undervalued at the moment.
Algorand price analysis: Conclusion
The Algorand price analysis shows the coin is trading at three months lower level as bears have been in the lead for the last 28 hours. Today the signs of the extension of the downtrend are obvious as the price was maintaining its level for the past week, but a major upset has caused the price function to go down further. The next support for ALGO is present at $1.21, and ALGO may revisit this support in the coming hours.
Disclaimer. The information provided is not trading advice. Cryptopolitan.com holds no liability for any investments made based on the information provided on this page. We strongly recommend independent research and/or consultation with a qualified professional before making any investment decisions.