- Cardano price analysis suggests upwards movements across the short-term charts
- The closest support level lies at $1.200
- ADA faces resistance at the $1.260 mark
The Cardano price analysis shows that after falling to the $1.350 mark the buyers were able to find a strong support level to stop the bearish activity. However, the bulls have been unable to initiate a rally as of now and so the price consolidates above the $1.350 mark.
The broader cryptocurrency market has observed a bearish market sentiment over the last 24-hours as most major cryptocurrencies observe negative price movements. Major players include LEO and WAX recording a 6.76 and a 5.11 percent decline, respectively.
Cardano price analysis: ADA recovers $1.250
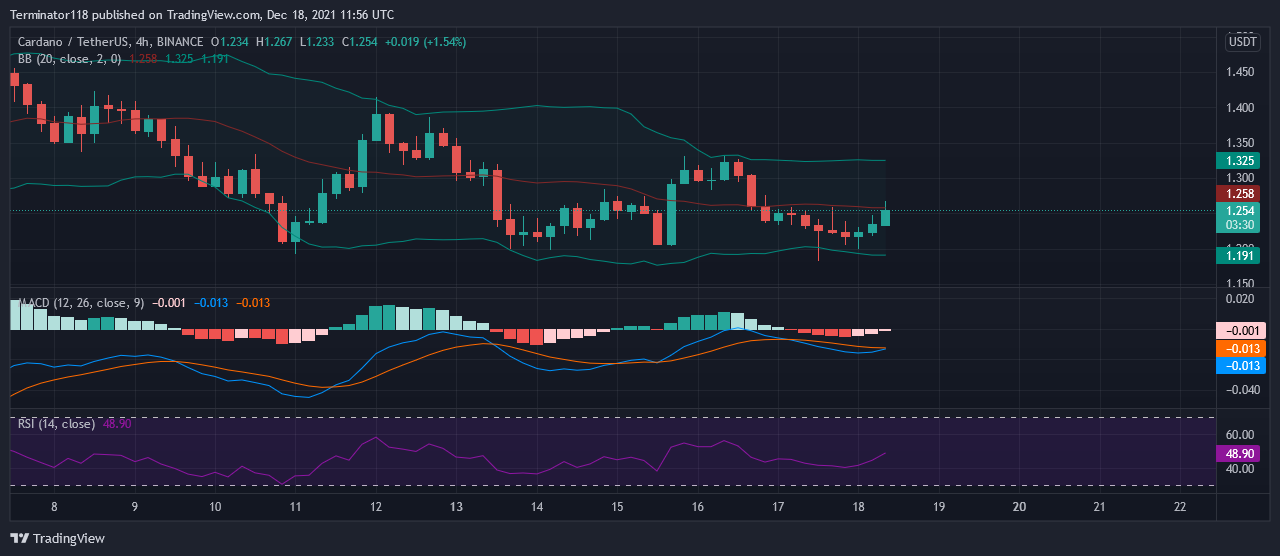
Across the technical indicators, the MACD is currently bearish as expressed in the red color of the histogram. However, the indicator shows low bearish momentum as the height of the histogram remains low at press time. Furthermore, the lighter shade of the indicator suggests a decreasing selling momentum across the short-term charts as ADA returns to the $1.260 price level.
The EMAs are currently trading low as ADA observes net bearish activity over the last few days as the price dropped from the $1.40 mark to the current $1.250 mark. At press time, the 26-EMAs move along the x-axis suggesting low dominance across the mid-term charts. On the other hand, the 12-EMA has reacted to the recent price movements and moves upwards suggesting a bullish convergence for the asset.
The RSI is currently neutral but trades low showing slight bearish dominance over the price action. The indicator hovers at 48.90 index units moving upwards with a low slope suggesting low bullish momentum at pres time. However, the neutral position of the indicator shows that ADA has room for significant movement in either direction before it would need a trend correction.
The Bollinger Bands are currently narrow and show further convergence as the price action makes a return towards the $1.258 mark. The oscillation around the $1.260 level cross the last five days shows that the price has been trading inside a consolidation channel with volatility dropping significantly. Currently, while the Bollinger Bands’ bottom line presents a support at the $1.191 mark, the mean line presents a resistance to the buyers at $1.258.
Technical analysis for ADA/USDT
Overall, the 4-hour Cardano price analysis issues a bear signal with 14 of the 26 major technical indicators showing support to the bears. On the other hand, only two of the indicators support the bears suggesting that there is little to no buying activity occurring in the markets. Meanwhile, the remaining ten indicators sit on the fence and issue no signals at the time of writing.
The 24-hour Cardano price analysis accentuates this sentiment and shows 15 indicators in favor of further downwards movement against two suggesting an upwards price action across the mid-term charts. The analysis reaffirms the bearish dominance over ADA. At the same time, nine indicators do not support either side of the market.
What to expect from the Cardano price analysis?
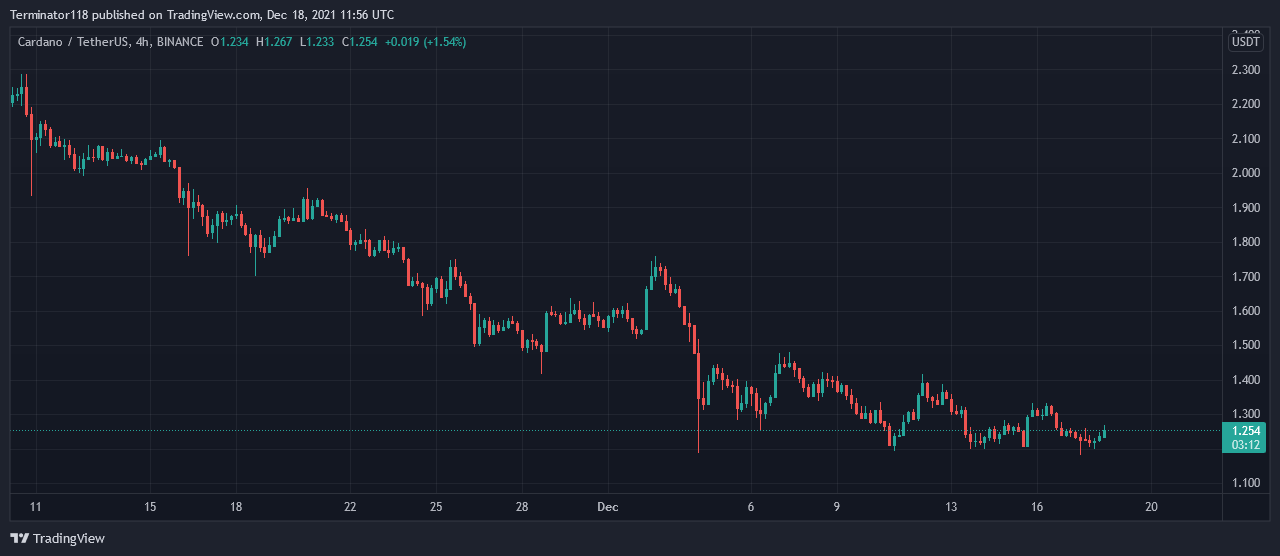
The Cardano price analysis shows that after making an attempt to climb up to the $1.400 mark, the bulls were rejected at the level and crashed to the $1.200 mark where they found support to bounce back on. The support level enabled the buyers to make a recovery to the $1.250 support upon which the price currently trades.
Currently, traders should expect the Cardano price analysis to move upwards towards the $1.300 mark as the bulls wrestle control of the price action from the bears. The short-term indicators reaffirm this suggestion suggesting an increasing bullish momentum in the short-term. However, the bulls would need to overcome the $1.260 resistance before that and the strong bearish pressure means that a rejection would cause a crash to the $1.20 price level