Kadena (KDA) was started two years ago by two former JPMorgan executives, Stuart Popejoy and Will Martino. They had both previously run JPMorgan’s Blockchain Center for Excellence, the American investment bank’s in-house blockchain team. It has both a private blockchain (where the public can’t view transactions) known as “Kuro” as well as an open-source smart contract component. This second part, the public chain, is in a special smart contract language called “Pact.” It enables anyone with a rudimentary understanding of programming to draft their own smart contract.
Moreover, Kadena claims to be able to handle huge numbers of transactions based on its blockchain protocol. For example, Kadena claims to handle 480,000 transactions per second (TPS). More than its competitor Solana, which can only do 50,000 TPS.
Let us see the technical analysis of KDA.
Past Performance of KDA
As of Nov. 2, it was trading at $6.95, but by Dec. 2 it shoots to $16.66. That represents a gain of 140% in the space of just one month.
The price today is $11.152 with a total trading volume of $52,608,469.73, which is down by 12% during the last 24 hours. The current ranking is #67, with a live market cap of $1,848,728,530.97. It has a circulating supply of 161,172,075 KDA coins. The highest closing price during the last 52 weeks has been $28.25 and the current prices are down 60% from it.
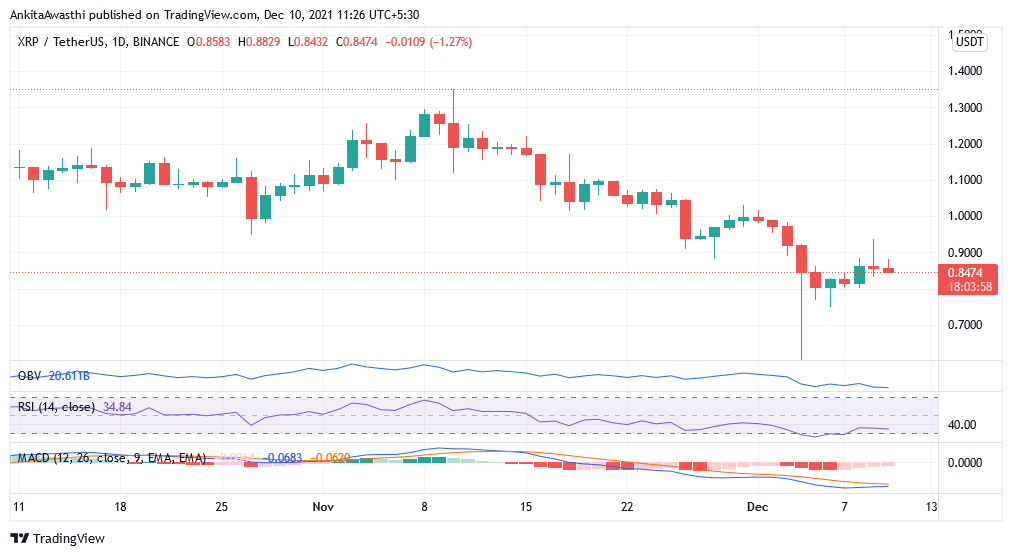
Source: https://www.tradingview.com/x/8ywN6Cj9/
KDA Technical Analysis
KDA has announced changes to its protocol that will allow it to take on new use-cases. It made changes that will give both users and developers the ability to mint and buy non-fungible tokens (NFTs).
The On-balance Volume is at 3.96 million, staying flat at the same level it was for a few months. Thus, there is no increase in volume traded.
RSI is at 40%, with a slight recovery from the overvalued sentiment. One can wait and watch for the sentiment to improve to sell, however, this might be a good steady movement.
The MACD can be seen with the fast and slow line falling in a converging manner with no real uptick of volumes. The slow line is above the fast line showing the fall is now being incorporated in the trend and there is no chance of a change as of now. Bearishness to continue.
Price Trends for the Day-Ahead and Tomorrow
The currently quoted KDA price is at $10.94 under the simple moving average, which can be considered a bearish signal. Both an important buy signal and sell signal pattern have been identified.
The buy signal pattern for KDA was detected and a price of $11.71 could be determined. The sell signal pattern could be determined at a price of $17.27.