- The Quant price analysis is bullish today.
- Resistance for QNT/USD is present at $198.8.
- The support is present at $187.5.
The Quant price analysis is bullish today, as the price has increased significantly. The Quant crashed heavily yesterday along with the market but recovered the entire loss by the end of the second half yesterday and continues upside today. Overall the QNT/USD has been on a downwards trend since 11th September, and after yesterday’s crash, expectations were low for Quant to recover to the extent it did, as the trend is downwards and Quant failed to peak during November when most coins reached ATH following Bitcoin rally. However, QNT is now near its strong support from where it started its rally towards ATH at the start of September.
The broader cryptocurrency market went through a heavy sell-off at the start of yesterday’s trading session when the Bitcoin lost more than 16 percent, but now the market is reviving as the Bitcoin has started to rise again, and many altcoins are also recovering with some recovering well enough above the lost value including Quant.
QNT/USD 1-day price chart: Bulls claim back 18 percent
The 1-day price chart for Quant price analysis shows an increase in price value today. QNT/USD traded in a range of $181 to $202 today. Quant is trading exactly at $196.4 at the time of writing. QNT has gained more than 18 percent value over the last 24 hours but still reports a loss of 0.81 percent over the past week as the overall trend line is still downwards. The trading volume has increased by 80 percent and the market cap increased by 17.51 percent resulting in the market dominance of 0.10 percent, ranking the QNT at 63 in the top 100 list.
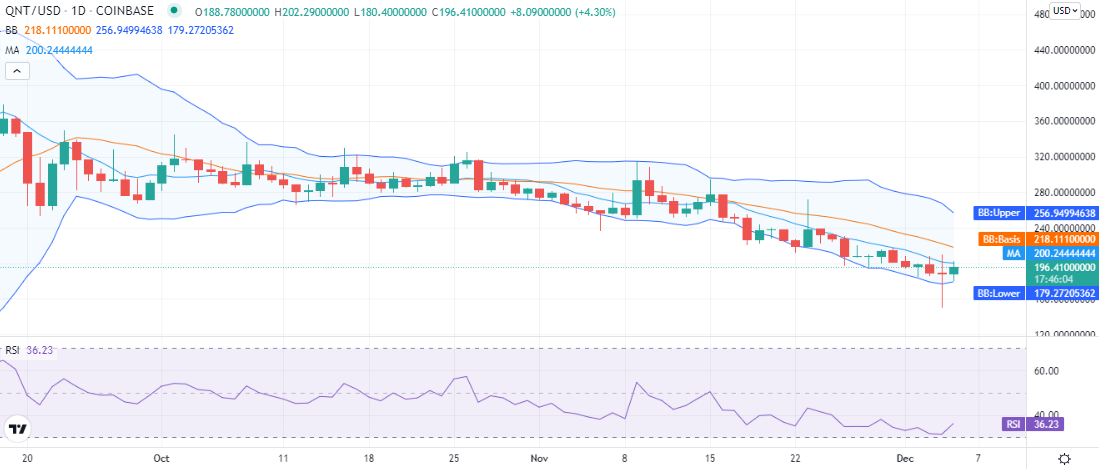
The volatility is comparatively high but is decreasing as the Bollinger bands show signs of convergence due to the set price pattern mostly. The price is trading between the lower limit and the mean average line of the indicator, which at $179 represents support for QNT and resistance at $218.
The relative strength index (RSI) has taken an upward turn after trading low for the past many days. The RSI is trading at index 36 on an upwards curve, hinting at the buying activity in the market.
Quant price analysis: Recent developments and further technical indications
The 4-hour price chart for Quant price analysis shows the price breakout was downwards today as the coin was correcting since the last four hours of yesterday’s trading session, which continued today as well, but a good spike has been observed after that as the price has increased after that significantly.
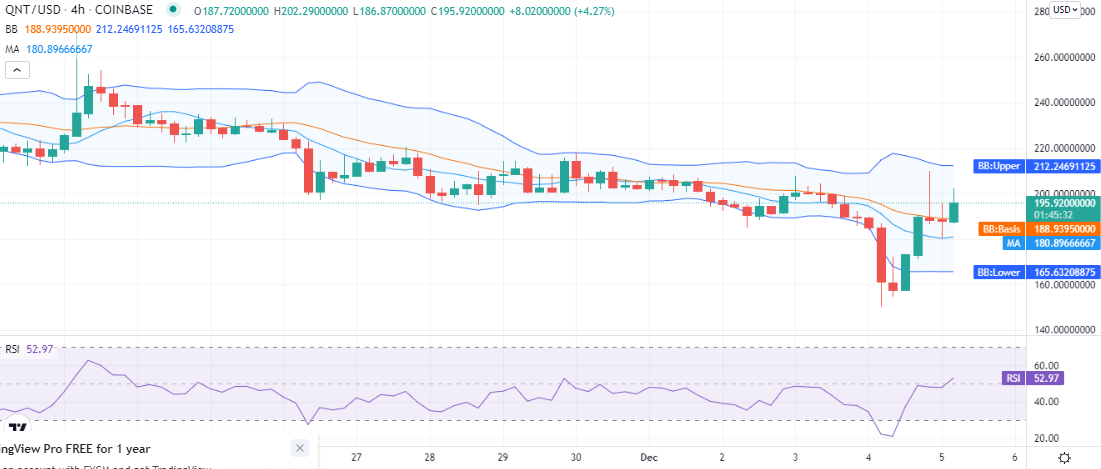
The volatility is high on the 4-hour chart as the Bollinger bands started expanding on 4th December and are still expanded. The price has traveled above the mean average of the Bollinger bands today, and the moving average is trading at $180 below the price level as well. The RSI is on an upwards trend at index 52.
Quant price analysis conclusion
The Quant price analysis shows the coin’s price has improved today, but overall the downtrend line still dominates, and the downtrend is expected to continue, But QNT is now near its strong support level at $187, and we expect it to bounce off from here after three or four trading sessions. If it did not, then the next strongest support level is present at $177.
Disclaimer. The information provided is not trading advice. Cryptopolitan.com holds no liability for any investments made based on the information provided on this page. We strongly recommend independent research and/or consultation with a qualified professional before making any investment decisions.