- GXChain price analysis is strongly bullish today.
- Selling pressure was observed at the $4.6 level.
- The nearest support for GXC is found at $2.78.
The GXChain price analysis is highly bullish today, as the token continued racing today after starting the bullish rally yesterday. Some selling pressure was observed when the token reached the $4.6 level, and the token spiraled down to $3.6, but bulls don’t seem to be calming down as of now as the token continues to race higher and higher beyond expectations.
The token started racing yesterday after the announcement of rebranding by GXChain. The Blockchain announced its rebranding by proposing a comprehensive revolution step by step. The new name is REI, and the three letters are derived from Rapid, Economical and Innovative, which will be the key features of the REI network.
GXC/USD 1-day price chart: GXC continues to race
The 1-day price chart for GXChain price analysis shows astonishing results as the token raced high beyond speculations. The GXC/USD is trading at $4.04 at the time of writing, while the price is racing so fast that the value is changing every minute. GXC has gained an enormous 580 percent value during the last 24 hours and more the 700 percent value over the last week alone, majorly accounting for the last two days, including today. The trading volume has surged through the roof by 19571 percent, which is not a normal figure by any means, but it indicates the traders’ keenness in the token.
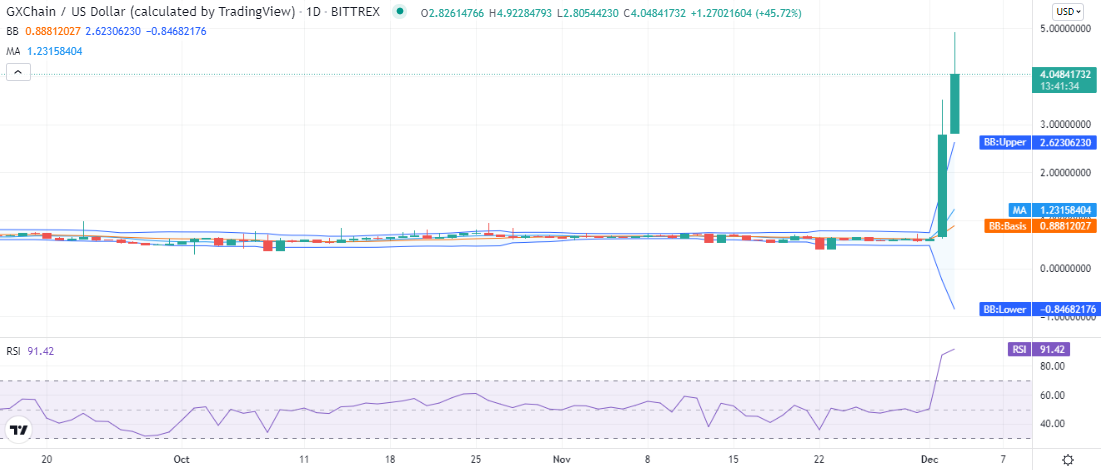
The volatility indicator shows sharp divergence on both sides as the upper limit of the Bollinger bands has reached $2.62, still far below the price level, and the lower limit has stooped low into the negative at $-0.84 level. The moving average is also present at the $1.23 mark.
The relative strength index (RSI) indicates the GXC is way overbought at the time as the RSI is trading in the overbought region at index 91 and still continues to travel on an upwards slope, hinting at the fast pace of buying activity among traders.
GXChain price analysis: Recent developments and further technical indications
The 4-hour price chart for GXChain price analysis shows the token made the very first jump during the second half of the previous trading session yesterday when it raced towards $2.6, and the price capped at $2.77 later yesterday. The token continued to rally high today as well and reached $4.5 in a swift move but reverted back from this point towards $3.6. And the GXC/USD token is racing higher again now as the price is touching $4.04 at this time, aiming for further upside.
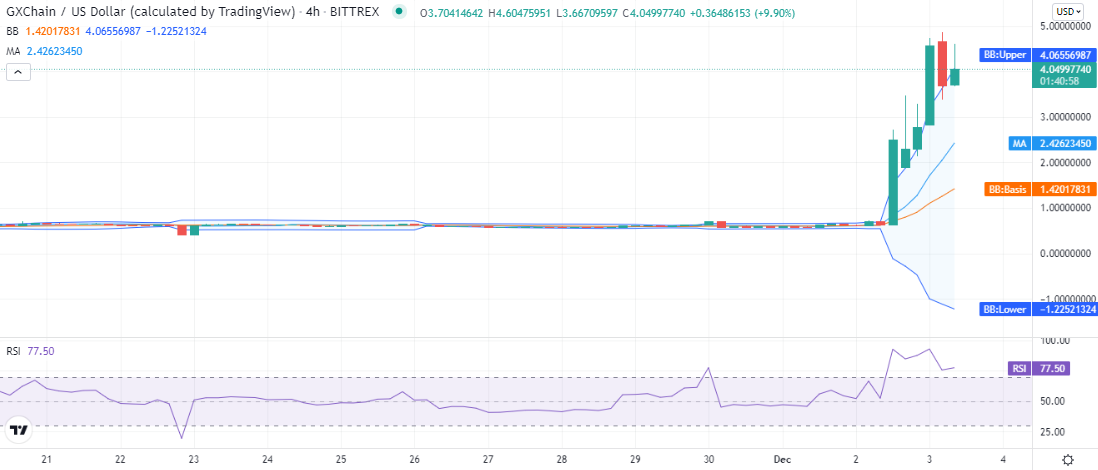
The volatility is high on the 4-hour chart as well as the Bollinger bands are vastly expanded at the moment. The RSI cooled down a bit as the price came down during the last four hours, but the RSI curve is again lifting up, indicating the start of a new buying wave.
GXChain price analysis: Conclusion
The GXChain price analysis suggests the token is highly bullish for today as well, as traders seem to be keener on the future of the token, and prospects look brighter for GXC. We anticipate GXC/USD to continue upside today, and chances are imminent for it to break above the $5 psychological mark today.
Disclaimer. The information provided is not trading advice. Cryptopolitan.com holds no liability for any investments made based on the information provided on this page. We strongly recommend independent research and/or consultation with a qualified professional before making any investment decisions.