- Solana price analysis is bearish today.
- The resistance is present at $238.
- Support for SOL/USD is found at $222.
The Solana price analysis shows the coin was rejected from the further upside at the $234 range. The past week proved good for SOL/USD pair as the coin covered the range upwards, gaining significant value and recovered from the loss of the 26th November flash crash even continued higher than that towards challenging $230 resistance and converting it into a support level earlier. This is the exact support the price is rested on at the time of writing. This support seems strong yet, and we believe the SOL may bounce up from this level if the support persists.
SOL/USD 1-day price chart: Price steps down to $230
The 1-day price chart for Solana price analysis shows the coin has covered the downwards range today as the price reduced from $234 to $230 today. Due to the bullish trend for the past week, the coin still reports an increase in price value by 1.24 percent over the last 24 hours and a good 22.3 percent increase in value over the last week. The trading volume is down by 8.17 percent today, resulting in a market dominance of 2.70 percent.
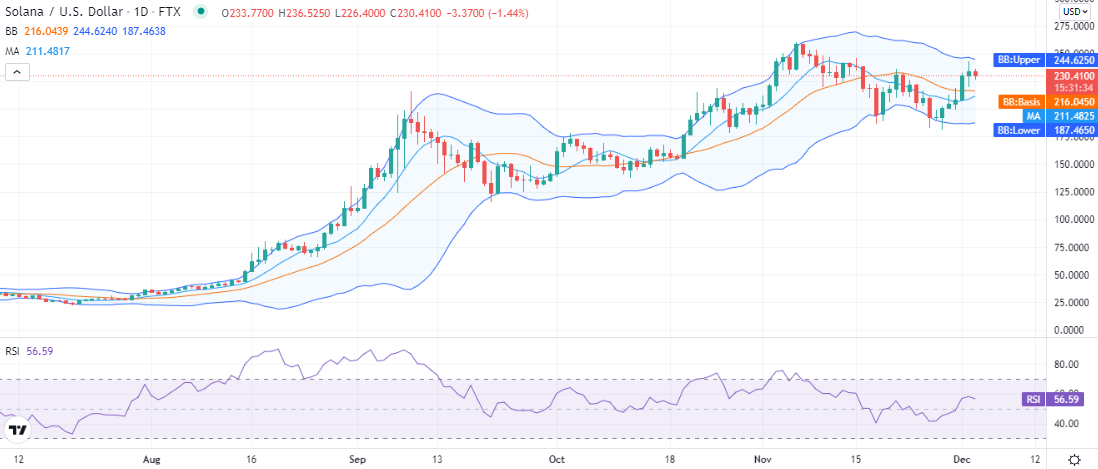
The volatility is comparatively on the higher side, with the upper limit of the Bollinger bands at the $244 mark representing the resistance level for SOL/USD, and the lower band is present at the $187 mark. The average of the indicator at the $216 mark represents support for the coin.
The moving average is trading below the volatility indicator’s average line at the $211 mark. The relative strength index shows the selling pressure as it indicates the selling activity presently going on in the market, which is imminent from the downside curve of the RSI as it is trading at index 56.
Solana price analysis: Recent developments and further technical indications
The 4-hour price chart for Solana price analysis shows the coin breakout towards the downside today, and the price went down to $230, swinging as low as $226 at a time. Later on, bulls tried to take over the market as some improvement towards $232 was observed, but bears took the lead again later and are continuing their endeavor. However, the overall trend on the 4-hour chart is upwards, so another bullish recovery can be assumed to start any time again in the coming hours.
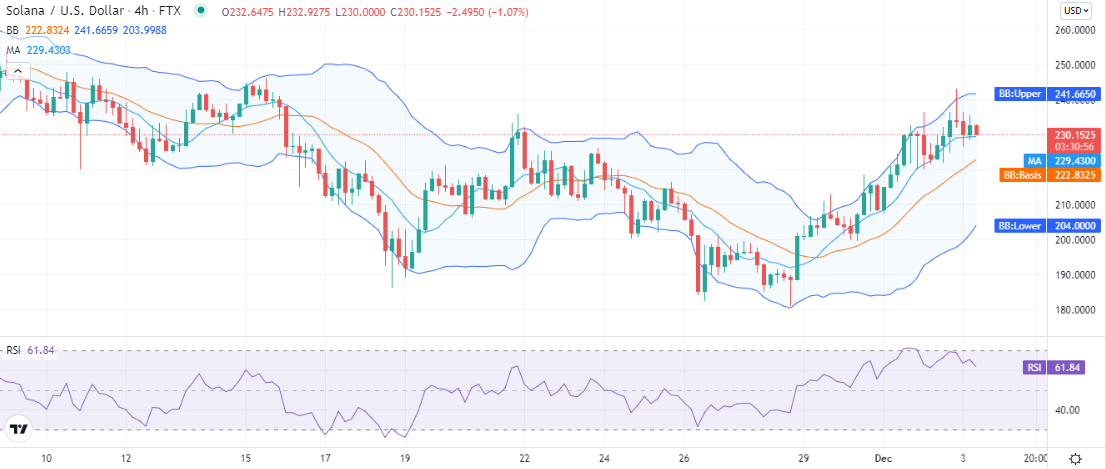
The volatility on the 4-hour chart is high as the Bollinger bands are covering more area and project a wider trading band for the SOL from $204 on the lower side to $241 on the higher side, and the price is expected to trade in the prescribed price channel. The RSI shows a steep downwards curve here but is near the overbought region at index 61.
Solana price analysis: Conclusion
The Solana price analysis though still on the bearish side, but the coin has a tendency to turn bullish any time today, as recently a bullish recovery was also observed, so we anticipate the SOL to maintain above $230 even a breakout above $234 is also possible later today.
Disclaimer. The information provided is not trading advice. Cryptopolitan.com holds no liability for any investments made based on the information provided on this page. We strongly recommend independent research and/or consultation with a qualified professional before making any investment decisions.