The XLM coin price hints at a bullish reversal within the ascending triangle in the daily chart as the price finds demand near the support trendline.
Stellar is an open-source network that allows money to be stored and moved. When it first came out on July 14, 2014, one of its objectives was to increase access to financial services by reaching out to people who aren't banked. However, within a short time, its focus was changed to assist financial companies to connect with each other using blockchain technology.
Let us now move ahead to the technical analysis of the Stellar token.
Past Performance of XLM
The XLM token price action forms an ascending triangle pattern in the daily chart. Moreover, the coin price shows bullish growth near the support trendline. Hence, traders can find buying opportunities at current prices with the target of $0.40.
Moreover, the chances of a bullish breakout of the ascending triangle increase as the price coils up within the pattern. Hence, safe traders looking to catch a directional move can wait for the pattern breakout.
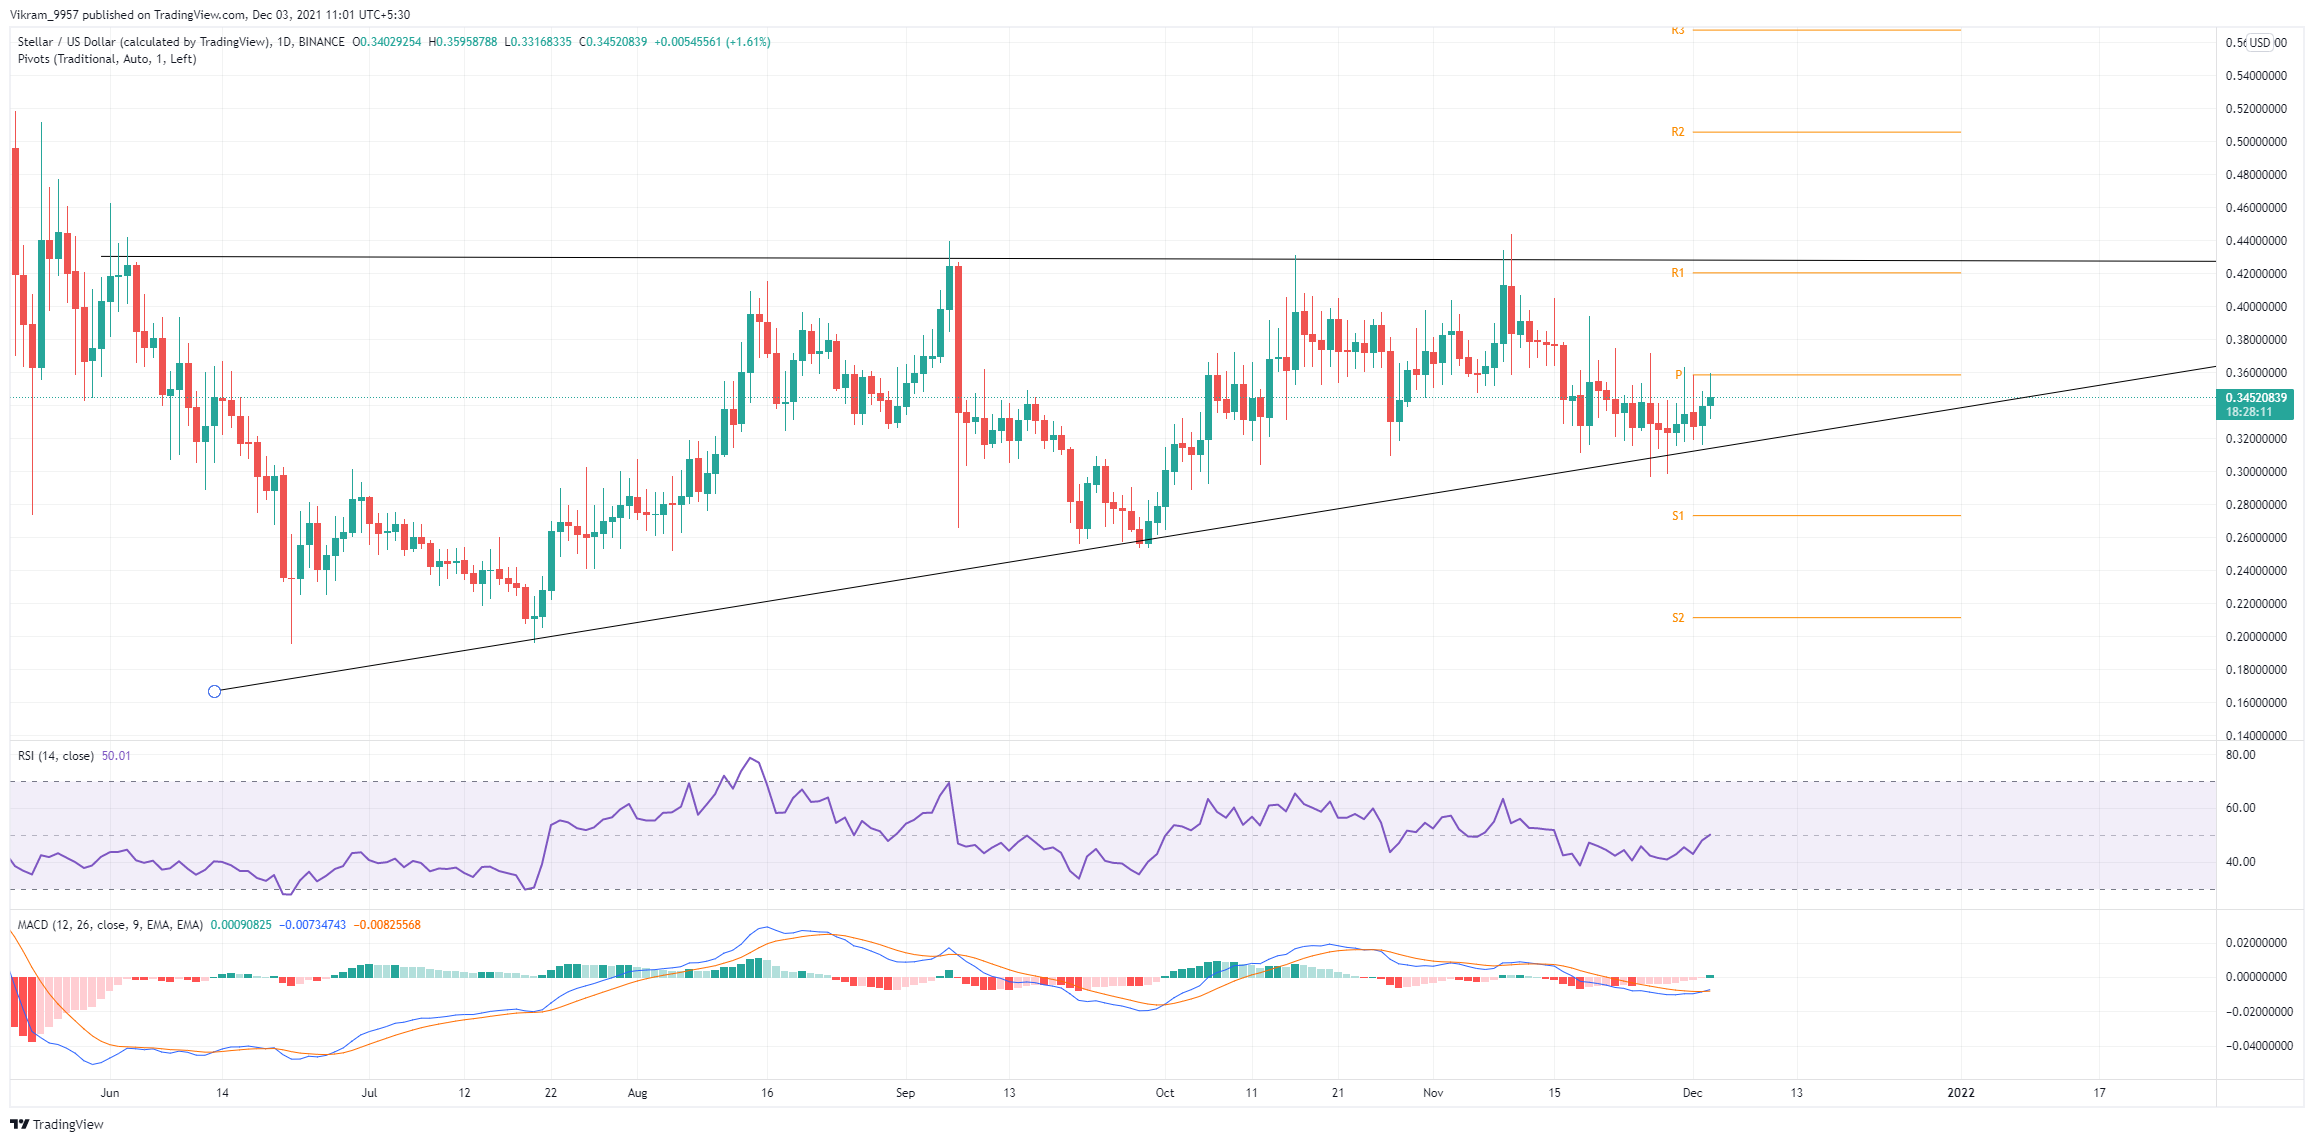
XLM/USD Daily Chart
XLM Technical Analysis
It is worth noting that the XLM coin price on the daily chart displays Pivot Levels between the $0.41 and $0.50 levels which can lead to the reverse of the bearish trend. On the other side, the support levels are $0.27 and the $0.21 mark.
The RSI indicator gains bullish momentum as the slope crosses above the neutral line (50) within the day chart. Hence, the slope enters the nearly overbought zone with the recent spike. With this, the indicator gives a buy signal for the XLM token.
The MACD and the signal line trend higher to approach the zero line mark in the daily chart. Moreover, the lines give a bullish crossover. Hence, the indicator gives a buy signal.
Upcoming Trend
The XLM coin price action forecasts a bullish reversal as the support trendline pushes the price higher. Hence, a price jump to the $0.40 mark is possible within the next week or so.
Moreover, the breakout of the ascending triangle is close as the price coils up within the pattern. Hence, traders can find entry opportunities to ride a directional move shortly.