- Polkadot price analysis suggests downwards movement to $35.00
- The closest support level lies at $34.91
- DOT faces resistance at the $36.85 mark
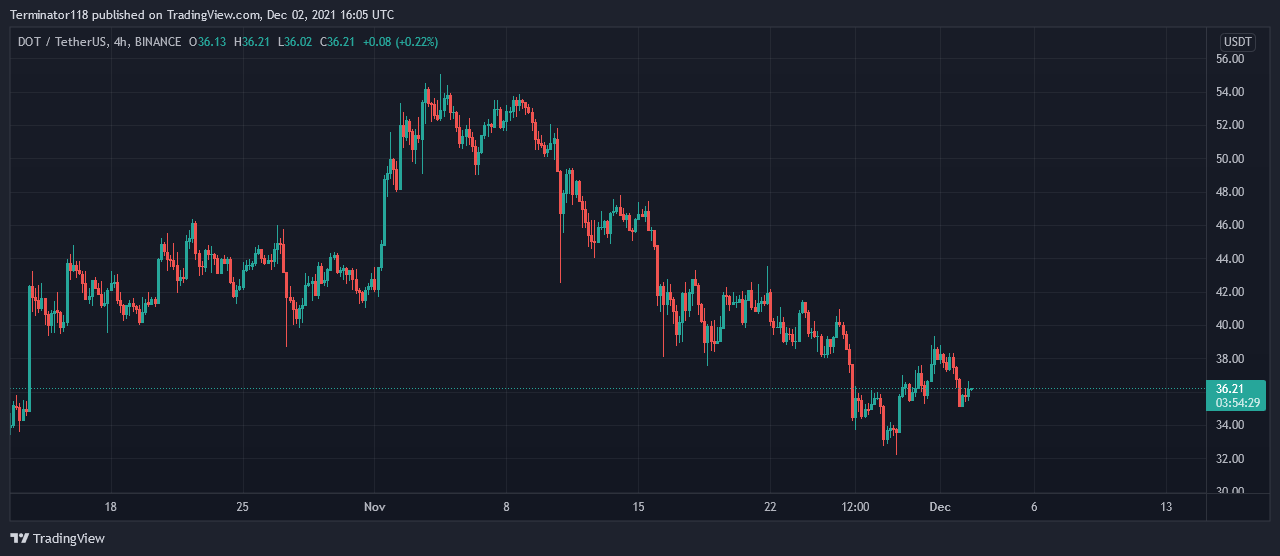
The Polkadot price analysis shows that after falling to the $35.00 level, DOT was unable to recover to $40.00 as the selling pressure remained high. Currently, the price appears to be recovering to the $37.00 mark, but the selling pressure makes it difficult for the bulls to gain momentum.
The broader cryptocurrency market has observed a bearish market sentiment over the last 24-hours as most major cryptocurrencies record negative price movements. Major players include AVAX and VET recording a 9.47 and a 6.02 percent decline respectively.
Polkadot price analysis: Selling pressure high as DOT consolidates below $37
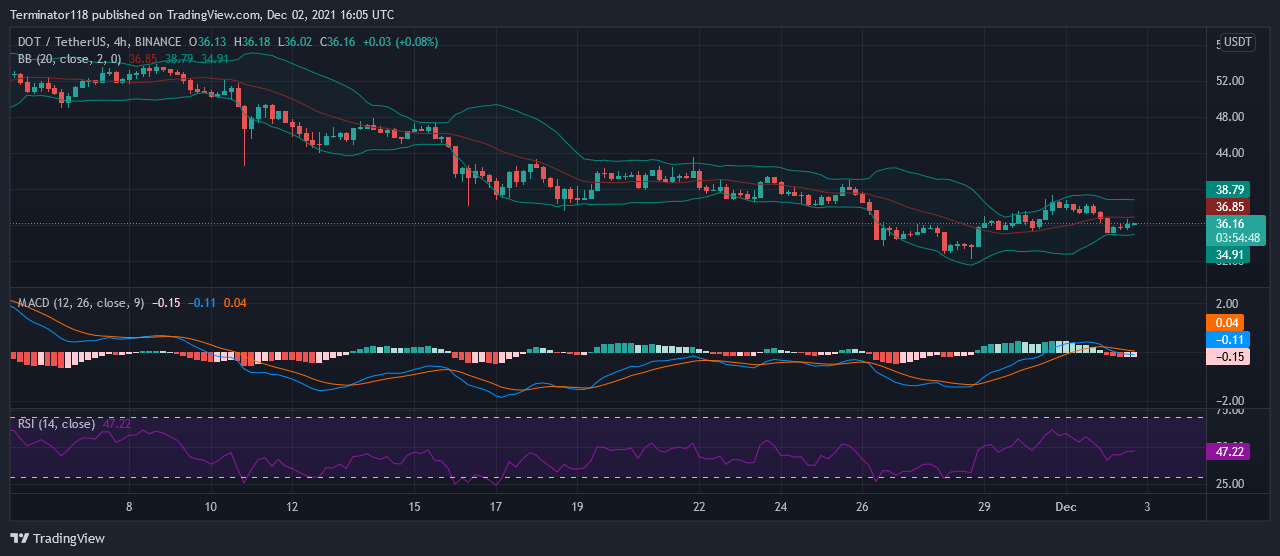
Across the technical indicators, the MACD is currently bearish as expressed in the red color of the histogram. However, the momentum is low as the price action observes low volatility across the last few days as DOT continues hovering around the $37.00 mark. The indicator only made a bearish crossover earlier today and was trading in the bullish region before that.
The EMAs are currently trading at a position close to the indicator’s mean as Polkadot observes little net movement across the last seven days. At press time, both of the EMAs are moving downwards showing strong selling pressure at the level. However, the bearish momentum is not increasing as the two EMAs move with similar slopes.
The RSI is currently neutral and trades close to the mean position at 47.22 index units showing low momentum at press time towards each side. The indicator is currently moving along the horizontal axis showing low trading activity occurring in the markets as traders speculate about the asset’s next movement.
The Bollinger Bands are currently narrow and show low price volatility for the Polkadot price analysis as DOT consolidates around the $37.00 mark. Currently, the bands’ mean line presents a resistance to the bulls at $36.85. Conversely, the bottom line at $34.91 provides a support level for the buyers to fall back on. However, as the bands converge, a breakout becomes more probable suggesting that the volatility may spike in the next few days.
Technical analysis for DOT/USDT
Overall, the 4-hour Polkadot price analysis issues a strong sell signal with 16 of the 26 major technical indicators showing support to the bears. On the other hand, only one of the indicators supports the bulls suggesting that there is little to no buying activity occurring in the markets. Meanwhile, the remaining nine indicators sit on the fence and issue no signals at the time of writing.
The 24-hour Polkadot price analysis shares this sentiment and also issues a sell signal with 13 indicators suggesting a downwards price movement against only five suggesting an upwards movement. The indicator reaffirms the bearish pressure acting on the Polkadot price across the mid-term charts. At the same time, ten indicators remain neutral and do not support either side of the market at press time.
What to expect from the Polkadot price analysis?
The Polkadot price analysis shows that after falling below the $40.00 mark, DOT has found it difficult to recover the bullish momentum to break upwards. While the price action made some recovery today, the bearish pressure still appears to haunt the price action.
Currently, traders should expect the Polkadot price analysis to move downwards to the $35.00 support level as the selling continues. However, the price action can be expected to hold the level as the bears are exhausted as well. If the buyers prevent further downwards movement, then the price may start its recovery towards the $40.00 mark in the next few days.
Disclaimer. The information provided is not trading advice. Cryptopolitan.com holds no liability for any investments made based on the information provided on this page. We strongly recommend independent research and/or consultation with a qualified professional before making any investment decisions.