- The Polygon price analysis is bullish today.
- Resistance for MATIC is present at $2.13.
- Support for MATIC is present at $2.04.
The Polygon price analysis is bullish for today as the price has jumped further high today. The current bullish momentum of MATIC is quite overwhelming as MATIC has managed to make several high spikes during the last five days. Yesterday’s bullish momentum was of quite an impact as MATIC broke through the crucial resistance of $1.92, and the price was capped at a $2 psychological mark while swinging as high as $2.09. Today bulls smashed the next resistance present at $2.04 in a swift move, and now they are aiming for $2.13 resistance, which also is a crucial resistance level.
MATIC/USD 1-day price chart: Bulls lead the price to $2.10
The 1-day Polygon price analysis shows the MATIC has already set a monthly higher high as it capped at $2 yesterday, marking a monthly high, and today MATIC continued further upside and is now trading hands at $2.10 at the time of writing as it aims for $2.13 next. MATIC reports an increase in price value up to 10.3 percent over the last 24 hours, and MATIC also reports an attractive gain in value amounting to more than 20 percent over the past week. The recent bullish momentum also attracted traders’ attention which is why the trading volume has also increased by 142.21 percent, and the market cap has gone up by 9.93 percent overnight.
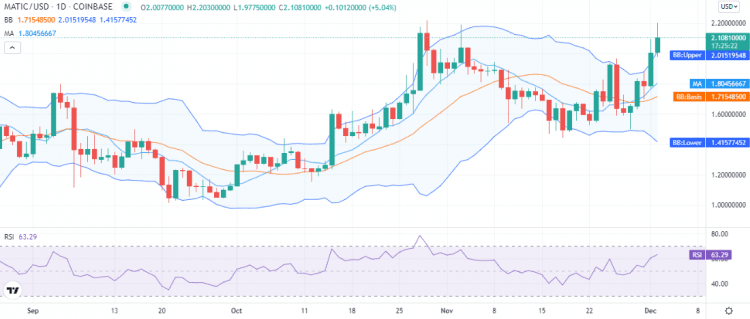
As MATIC continues to surge, the volatility indicator is also trying to keep up with the high surging price as it is also diverging on a steep angle. The upper value of Bollinger bands has reached the $2.01 mark representing support for the coin, and the lower band has reached down to the $1.41 mark, while the average line of the Bollinger bands at the $1.71 mark represents the second line of support for MATIC.
The relative strength index (RSI) continues to trade on an upwards curve. The RSI has reached the index 63 in the upper half of the neutral zone indicating the buying activity in the market for MATIC.
Polygon price analysis: Latest developments and further technical indications
The 4-hour Polygon price analysis shows the coin underwent correction during the last eight hours of yesterday’s session and retraced a good chunk during this time. But today, it started to rise up again, recovering the correction loss during the first four hours of today’s session and continues further upside now.
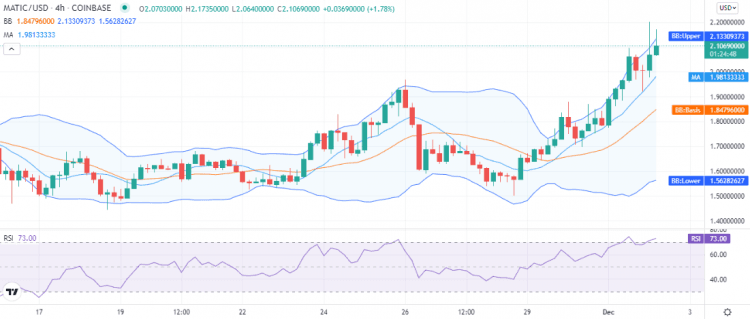
The volatility is high on the 4-hour chart, as the volatility indicator suggests. The upper end of the Bollinger bands has reached the $2.13 level, which indicates the resistance level for MATIC, and the lower band has reached $1.56. The average line of the indicator at the $1.84 mark represents the support level for MATIC. The MATIC is also overbought according to the 4-hour chart as the RSI has entered the overbought region and is trading at index 73 and maintains its upwards slope.
Polygon price analysis: conclusion
We anticipate MATIC to continue upside today, and the resistance at $2.13 seems to be conquered soon. If MATIC crosses through this resistance, then bulls will aim for $2.20, which according to the current scenario, is also possible. On the flip side, if the price reverts back, then it might hold back on to $2.0. If the pressure exceeds then, we might see the price rolling back towards the $1.84 support level.
Disclaimer. The information provided is not trading advice. Cryptopolitan.com holds no liability for any investments made based on the information provided on this page. We strongly recommend independent research and/or consultation with a qualified professional before making any investment decisions.