- Uniswap price analysis is bullish today.
- Resistance is present at $22.08.
- The support is present at the $21.8 level.
The Uniswap price analysis is bullish for today as the coin is enjoying the bullish swing. The price trend after the flash crash of 26th November has been upwards, as bulls have been leading the price function since then. Yesterday a minor retracement was observed towards $20.9, but today again, bulls are taking the price forward. During the last six days, UNI/USD has shown good progress and has recovered well.
UNI/USD 1-day price chart: Price on the rise as bulls have taken the reigns again
The 1-day Uniswap price analysis shows the coin traded in a range of $20.7 to $22.5 today. At the time of writing, UNI is trading hands at $22.04, and the resistance is present at $22.08, just above the price level. At this point, UNI may feel some market pressure as this is a crucial resistance level that bulls have to break through. UNI still reports a loss of 0.65 percent in value over the last 24 hours due to the retracement of yesterday, but it also reports an increase in price value by more than six percent over the past week. The trading volume has increased by 23.89 percent as well.
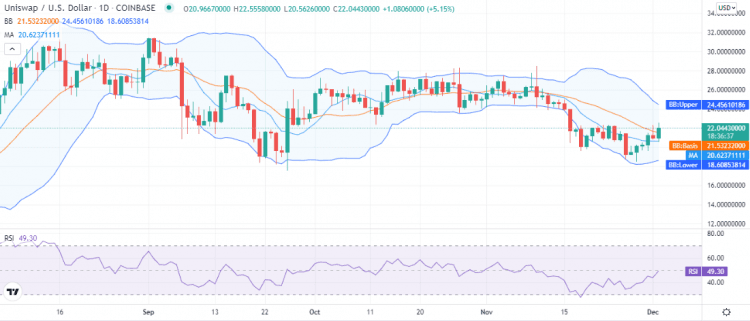
The volatility for UNI is decreasing as the Bollinger bands show convergence. The upper band has come down to the $24.4 mark representing the resistance zone for UNI/USD, and the lower band is at the $18.6 mark. The mean average of the indicator is present at the $21.5 mark representing the support level for UNI.
The price is trading above the moving average (MA), and the MA is preset at the $20.6 mark. The relative strength index (RSI) is on an upwards curve near the center of the neutral zone. The upwards curve of the indicator shows the buying activity in the market as it trades at index 49, leaving equal space for both bulls and bears.
Uniswap price analysis: Recent developments and further technical indications
The 4-hour Uniswap price analysis shows the coin retraced yesterday for most of the trading session but is on the rise from the start of today’s session as both the candlestick are green for today. Bullish momentum seems healthy as well.
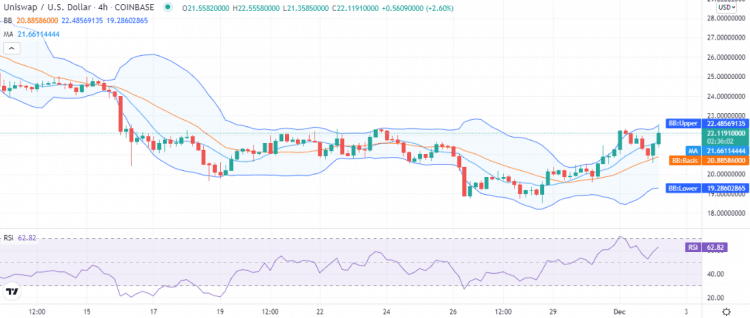
The RSI on the 4-hour chart is also trading on an upwards slope at index 62 in the upper half of the neutral zone, and there is still more room for bullish practice. The price has also traveled above the moving average today, which is present at the $21.66 mark. The volatility indicator is again showing signs of divergence as both extreme ends of the indicators have started to travel apart. The price is trading below the upper band, which at $22.48 represents resistance for UNI.
Uniswap price analysis: Conclusion
The Uniswap price analysis suggests the bullish momentum is healthy and after yesterday’s retracement bulls are ready for more upside. There exist imminent chances for UNI to make a breakthrough above the $22 resistance. If UNI breaks through this point, then there is stopping by till $23.9.
Disclaimer. The information provided is not trading advice. Cryptopolitan.com holds no liability for any investments made based on the information provided on this page. We strongly recommend independent research and/or consultation with a qualified professional before making any investment decisions.