- ANKR price analysis is bullish as prices climbed up by more than 13%
- The nearest resistance is present at $0.156, remains unbroken
- The closest support levels are present at $0.118
ANKR price analysis continues to surprise investors, rising by more than 13% when the entire market was bearish. The token saw an increased influx of investment from investors and reached a daily high of $0.16046.
The daily candle started the day at $0.12459 and dropped to a daily low of $0.14086 after a rally to a daily and weekly high. In the past week, the token’s lowest price was $0.1174, while the highest was $0.16046.
As per data from CoinMarketCap, the trading volume of the cryptocurrency rose by 679.12% and is resting at $950,514,141.83. Defying all odds, the token breached price resistances and took the 97th spot in the cryptocurrency market.
There was a 12.64% surge in the market capitalization of the token, which amounts to $1,144,304,804.72. According to CoinGecko, the token rose by 1302% in a time frame of one year.
ANKR price analysis using technical indicators
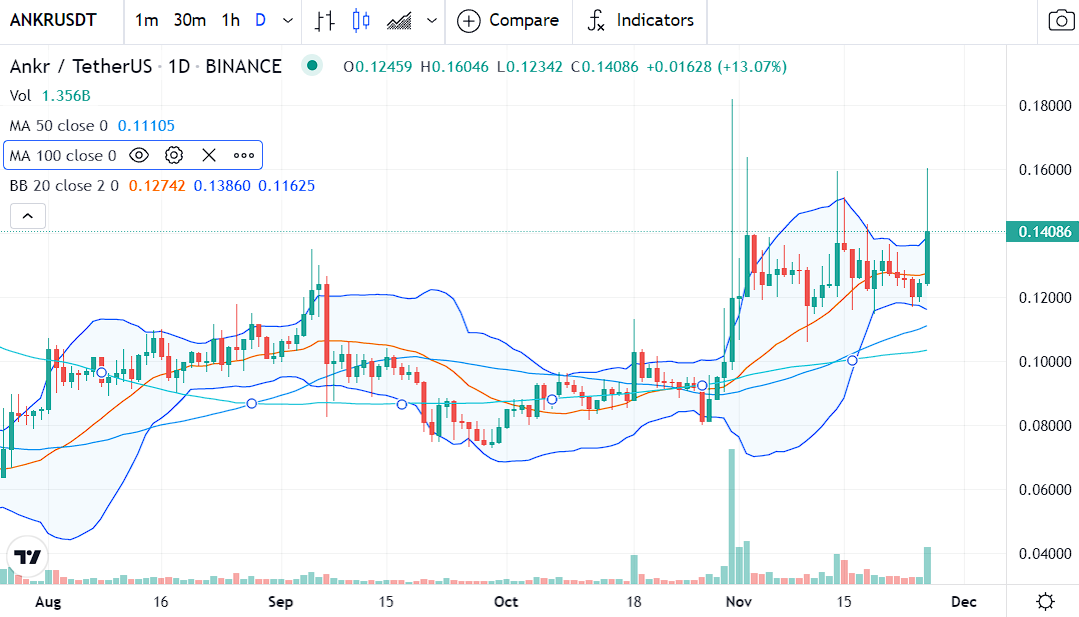
The technical indicators suggest a bullish price action for the token. ANKR is currently 32.2% low from its all-time high at $0.213513. The 50-day day and 100-day Moving Averages continue to progress below the price action, indicating a bullish trend being followed.
The prices broke out from the upper end of the Bollinger Bands. However, due to the surge in take-profit sentiment, the traders sold the token at the daily high, due to which the coin’s bullish growth was stunted.
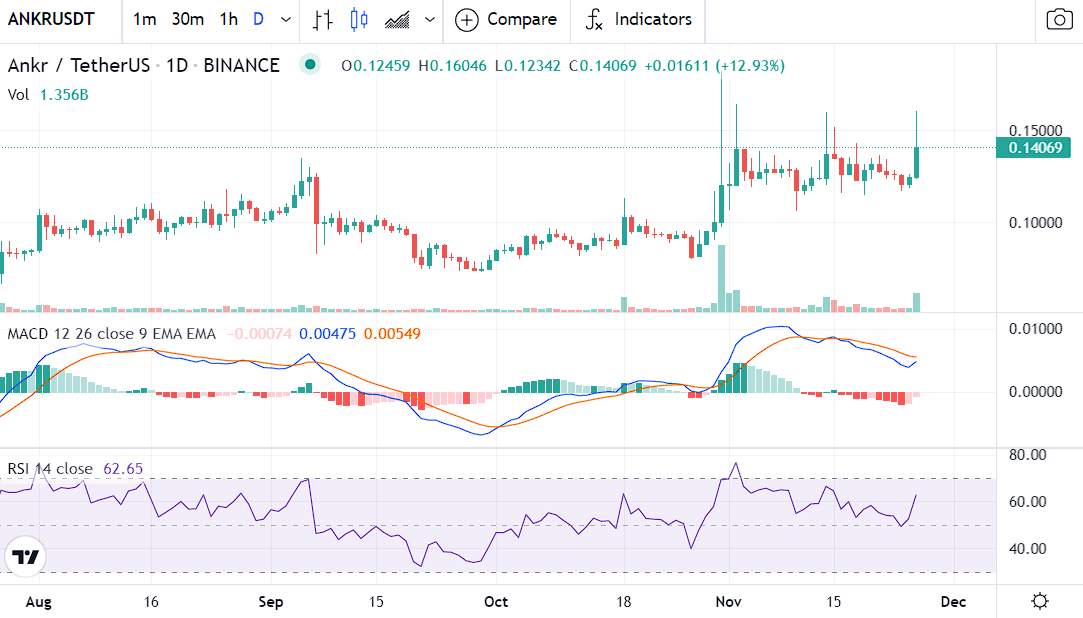
The MACD indicator is bearish as the MACD line continues to progress below the signal line (the orange one). But, the two lines are closing in on each other, and if the MACD line breaks above the signal line, a bullish divergence might be seen.
The RSI levels have entered the bullish region as buying pressure surged by massive rates. The MACD histogram is bearish, filled with red bars.
Conclusion
The ANKR price analysis suggests that bulls will continue to remain in charge of the price fractal. As the entire crypto market crashed to a $2.4 trillion market cap from nearly $3 trillion, ANKR turned bullish. On the other hand, Bitcoin prices turned bearish and dropped by more than 3%, and are retesting $54,000.