- Litecoin price analysis is bearish today.
- Support for LTC is present at $216.
- Resistance is found at $226.8.
Litecoin is again covering the downwards range as a decrease in price is observed today. The selling pressure has triggered again, and the bears have taken over the price function. The selling activity has affected the price, and more devaluation might be ahead.
The LTC/USD is overall sustaining its value above the $200 psychological mark after going through severe damage from 15th to 18th November when the coin was rejected from $280 and plunged down at $204. However, LTC managed to stop further slippage and seems like it is in a consolidation phase before it can rally again in the next week.
LTC/USD 1-day price chart: Bears ruling the charts
The 1-day Litecoin price analysis shows the price has decreased from yesterday’s price cap of 223. Today the LTC has traded in a range of $225 to $217 so far, and at the time of writing, the LTC/USD is trading hands at $219.72 exactly, but it is expected that the price will go further down, as the selling pressure is already there and after 18th November LTC is following a zigzag price pattern which looks like a consolidation pattern. LTC has lost 0.13 percent value over the last 24 hours, but it has also gained 7.82 percent value over the past week. On the other hand, trading volume has increased by 10.06 percent, and the market dominance is 0.57 percent.
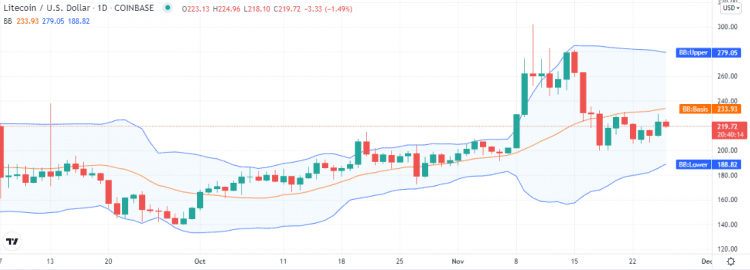
The volatility is also high, but the Bollinger bands show some degree of convergence, with the lower band covering more range upwards, while the upper band moves almost unchanged, hinting at the price to maintain its level on the broader spectrum and a rally upside may be observed in the coming days. The lower end of the indicator also suggests a support zone for LTC around $188 level, but on the flip side, the mean average of the indicator suggests a resistance level around $233 level for LTC.
The moving average (MA) is still below the price level at $216, but the price may step below the MA. And the relative strength index (RSI) has traveled down from the upper half to the lower half of the neutral zone; as the price stepped down to $219, the RSI has lowered to index 48.
Litecoin price analysis: Recent developments and further technical indications
The 4-hour Litecoin price analysis shows the coin is on a downwards trend from the last 12 hours, but the major loss was observed during the last four hours. However, now the LTC seems on its way to retest the support present at $216.
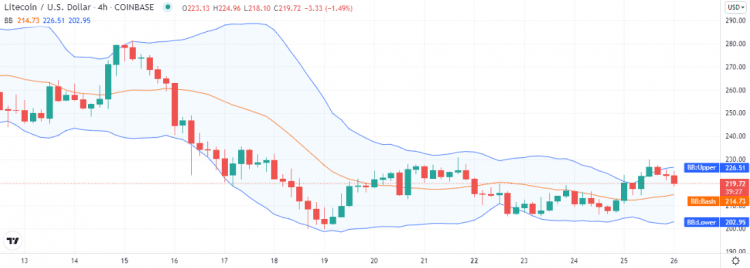
The volatility on the 4-hour chart is mild, with the price trading below the upper Bollinger band. The upper band and the mean average of the indicator represent resistance and support for LTC/USD at $226 and $214, respectively. The moving average is above the price level at the $220 level now, and the selling activity seems to be slowing down now as the price oscillation is low, which hints at the entry of bullish support soon.
Litecoin price analysis conclusion
The Litecoin price analysis concludes the coin is depreciating today in its consolidation phase. The bullish support may step in soon as the downwards price oscillation has slowed down. But for LTC to rally high, it must break out above the $231 resistance level. On the flip side, if the downtrend extends and LTC break below $203, this may cancel out the bullish scenario.