SushiSwap (SUSHI) has failed to break out from a long-term resistance area and is struggling to find support.
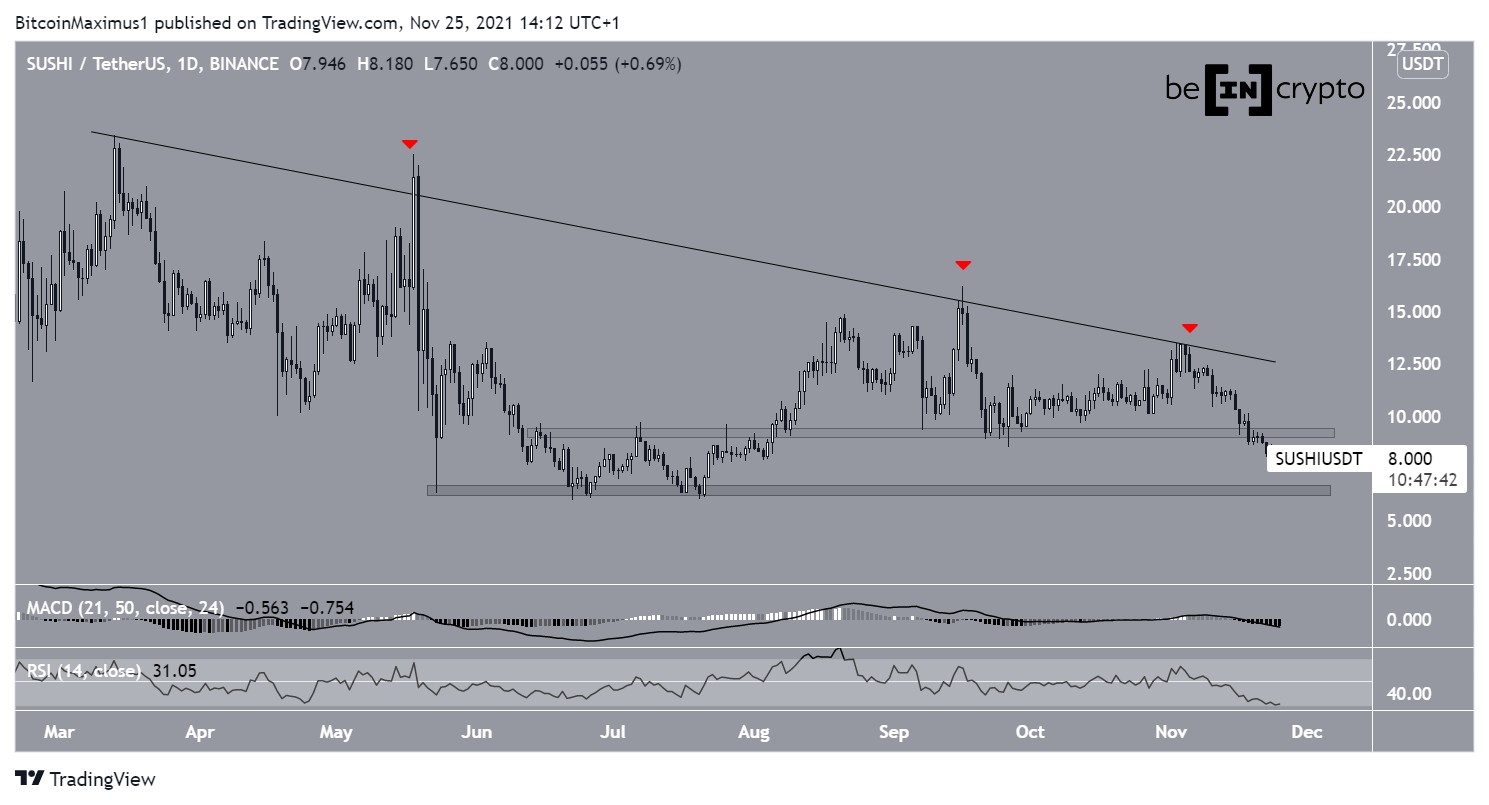
SUSHI has been decreasing alongside a descending resistance line since March 13, when it reached an all-time high price of $23.43. So far, it has been rejected thrice by this resistance line (red icons), most recently on Nov 4.
After the rejection, SUSHI fell below the $9.20 horizontal area, which acted as support since the beginning of Aug. The next support area is at $6.50.
Technical indicators in the daily time-frame support the continuation of the downward movement towards support.
The MACD, which is created by a short- and a long-term moving average (MA), is negative and falling. This means that the short-term MA is slower than the long-term one. It is associated with bearish trends.
Similarly, the RSI, which is a momentum indicator, is nearly below 30. Readings below 50 are considered bearish, and those below 30 occur when the price has been decreasing for a very long period of time.
Therefore, readings from the daily time-frame suggest that SUSHI will decrease towards $6.50.
Short-term movement
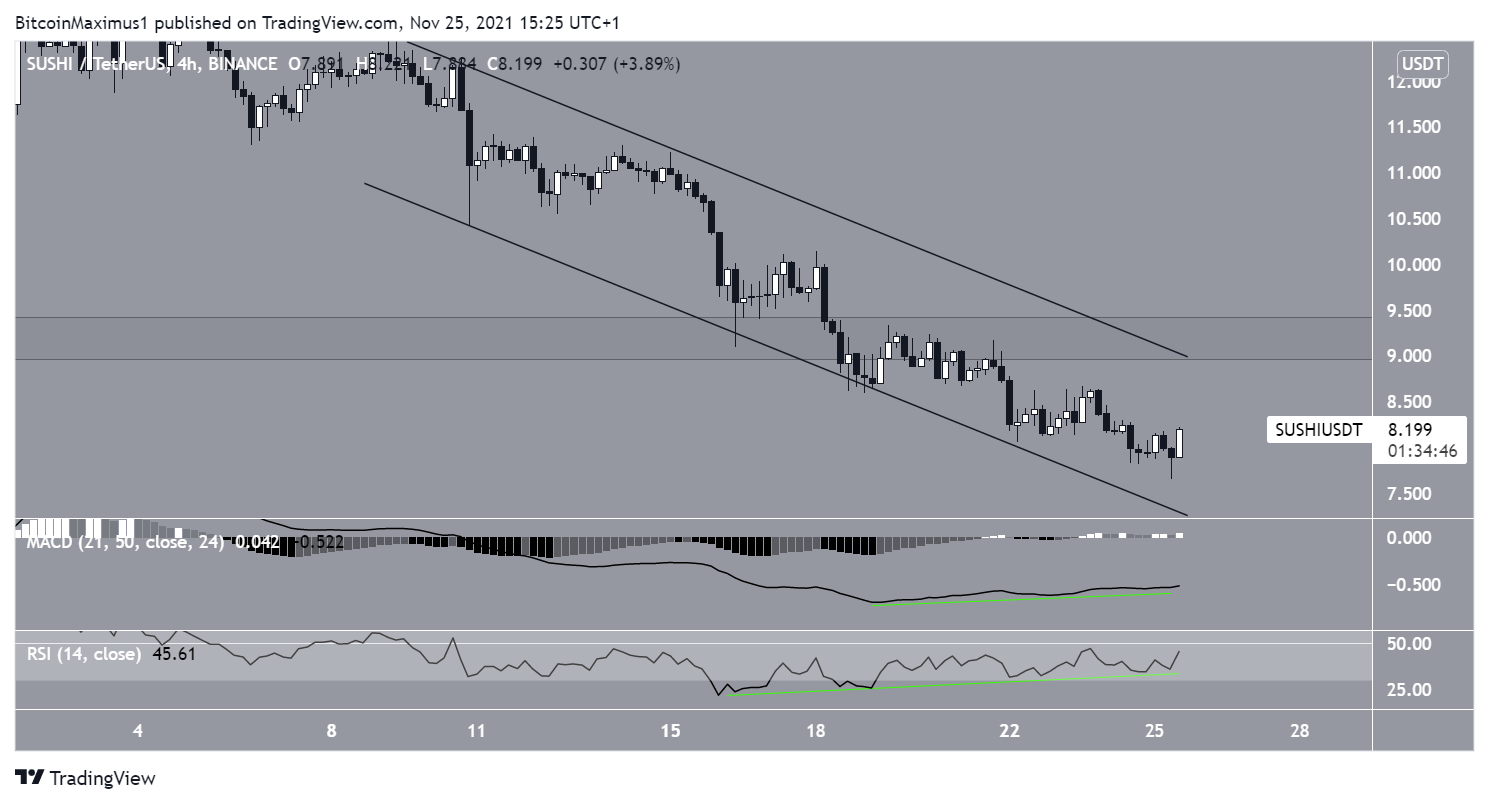
The shorter-term four-hour chart is more bullish.
First, it shows that SUSHI is trading inside a descending parallel channel. Such channels usually contain corrective movements. This means that they often led to a breakout, since the downward movement is considered corrective.
Furthermore, both the RSI and MACD have generated bullish divergence. This is an occurrence that often precedes bullish reversals.
However, the resistance line of the channel coincides with the previously supported area at $9.20. The area is now expected to act as resistance.
Therefore, until it is broken, the trend cannot be considered bullish.
SUSHI wave count
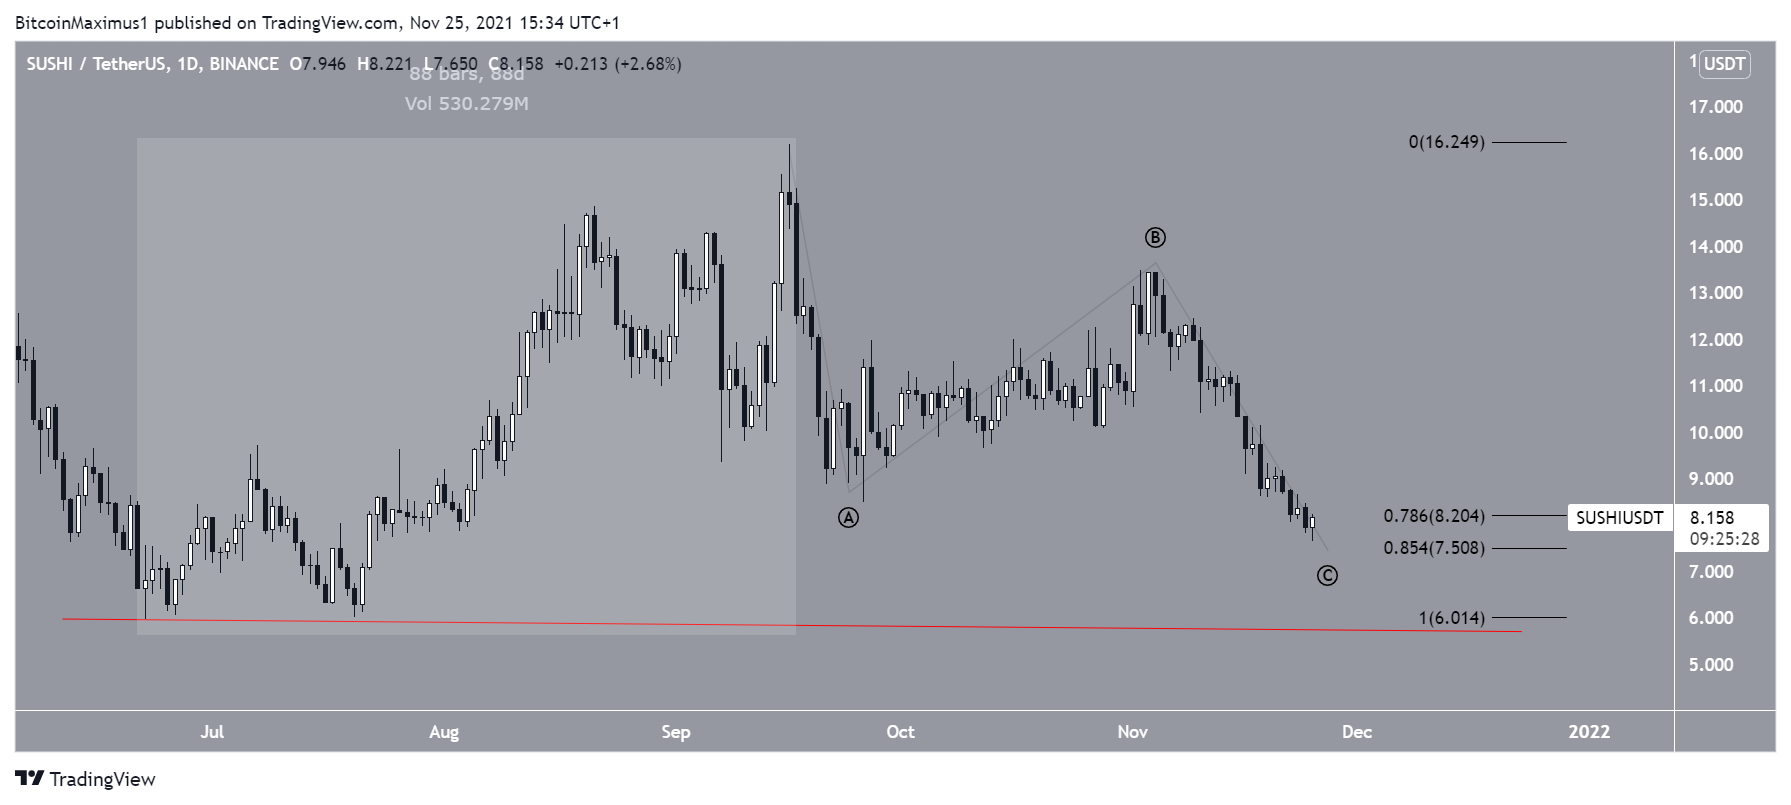
Cryptocurrency trader @TheTradinghubb outlined a SUSHI chart, stating that the correction is nearing its end.
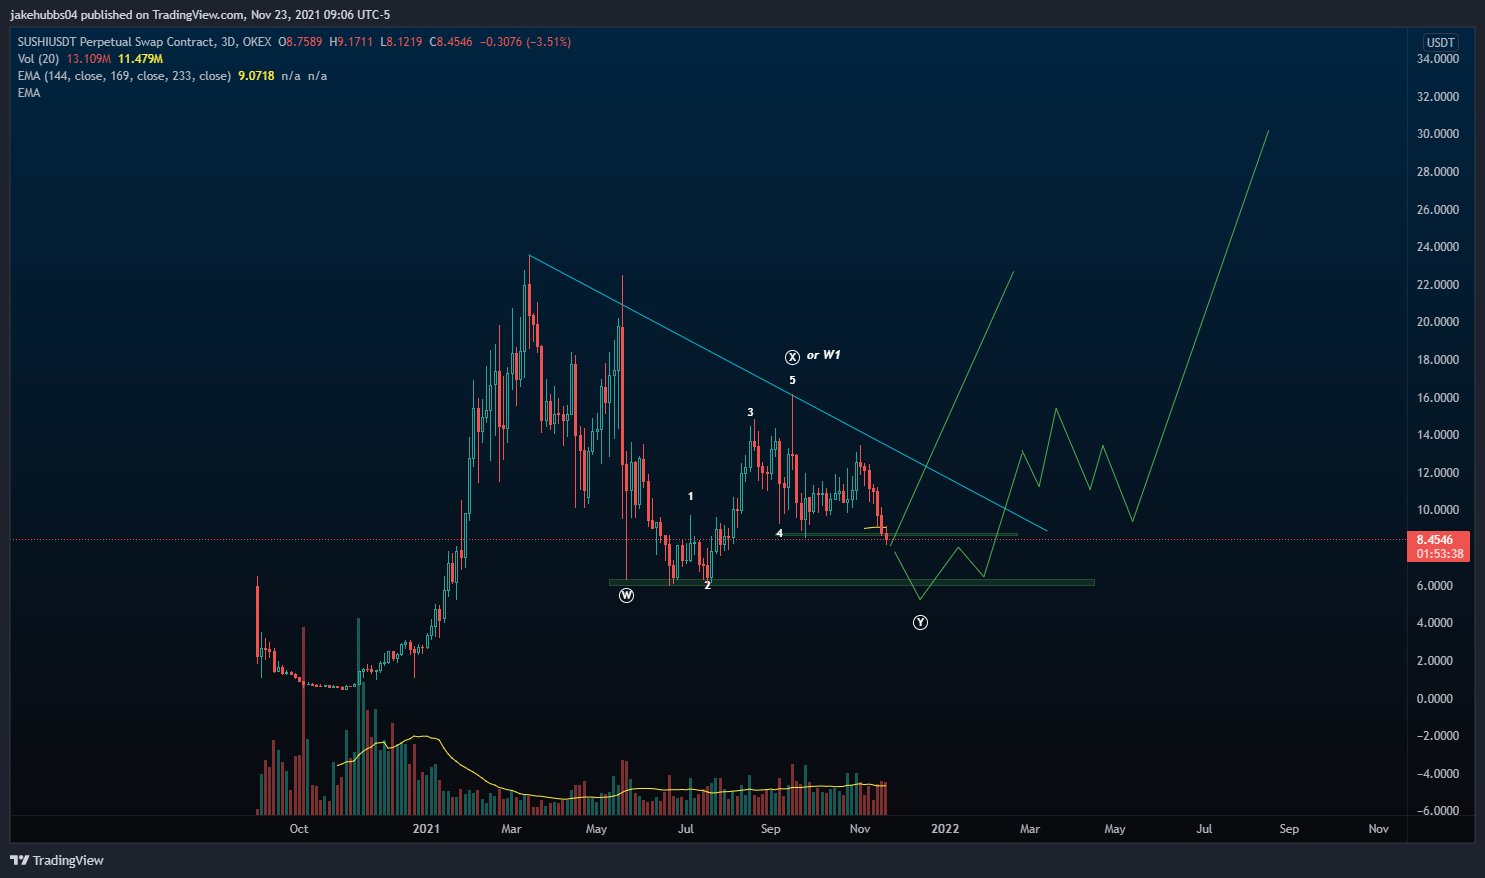
It is possible that an upward movement began on June 2 (highlighted). In this possibility, the current decrease would only be a correction.
However, in order for this to remain valid, SUSHI would have to reverse trend near its current level. The $7.50 – $8.20 area is the 0.786 – 0.854 Fib retracement support area. Therefore, it is the final Fib retracement support level.
A decrease below the June 22 low of $5.96 (red line) would invalidate this particular wave count.