Elrond is a blockchain protocol that seeks to offer extremely fast transaction speeds by using sharding. The project describes itself as a technology ecosystem for the new internet, which includes fintech, decentralized finance, and the Internet of Things.
Past Performance of Elrond
For about four months, the price is on a continuous uptrend. This rally has seen very little resistance in between. After stabilizing in the earlier part of the previous week, the later part witnessed another parabolic increase.
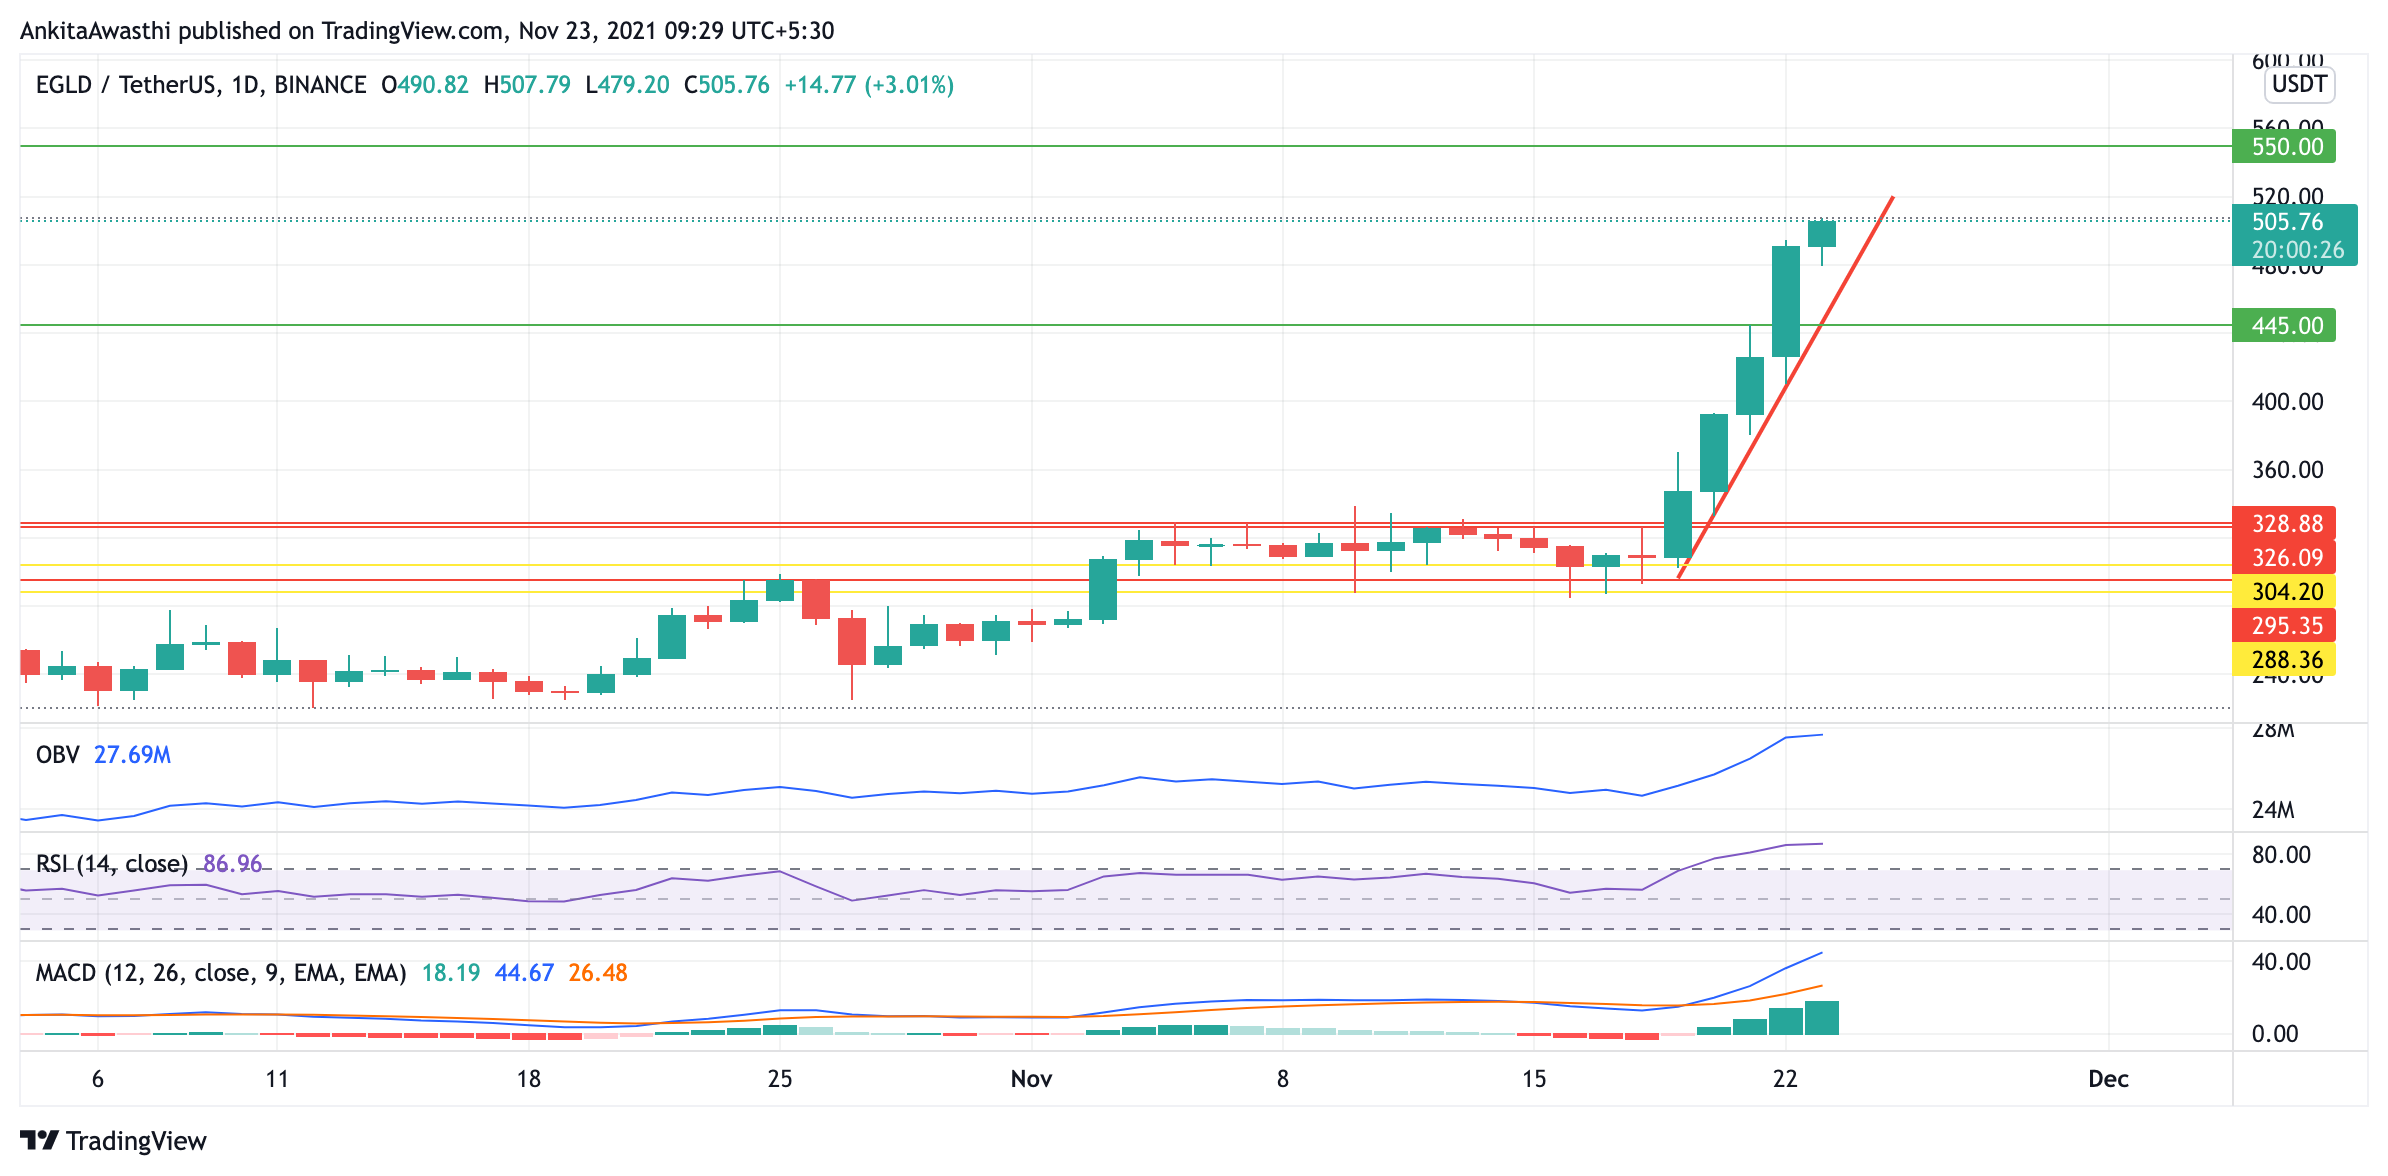
On November 16, 2021, EGLD opened at $315.26. On November 22, 2021, it closed at $490.35. Today, it has also made a new all-time high at $504.91, thus breaking the psychological barrier at $500 for the first time.
Source: https://www.tradingview.com/x/7cQptyxN/
EGLD Technical and Fundamental Analysis
Looking at the current momentum, it is expected that the price will increase further. Today, the current trading price is $503.56, which is 2.56% higher than yesterday’s close. However, before making a call, we must look at the indicators.
The OBV is showing an uptrend for the buying volumes dominating the selling volumes. This is a clear signal that there is pressure on the price to move upwards.
Not surprisingly, the RSI is at a high level at 86.99%. This indicates that the EGLD coin is highly overbought, and thus highly overpriced. A trend reversal may be seen anytime.
Looking at the MACD graph, we can see that even a bearish crossover could not stop the rally, and again a bullish crossover was seen. The fast line and the slow line both are positive, while the fast line is moving parabolically. This is a positive signal for the traders.
Elrond, the high throughput blockchain that can scale beyond 100,000 transactions per second at low latency and negligible costs, has announced a USD 1 billion liquidity incentive program to supercharge the launch of their Maiar DEX DeFi platform.
This is perhaps the largest DeFi incentive program to date and represents a strong step toward pushing DeFi adoption beyond the current boundaries of the crypto space, into the mainstream.
How to Read EGLD for Trading
The FIB numbers show that due to the previous week’s exponential increase, the price chart has crossed all the current FIB levels.
Thus, two indicators are strongly positive while one is giving a red flag. To take advantage of the current momentum, the traders may take a long position by keeping a target at $550. However, looking at RSI’s warning, they should also keep a stop-loss at $445.