Solana is a highly functional open-source project that banks on blockchain technology’s permissionless nature to provide decentralized finance (DeFi) solutions. While the idea and initial work on the project began in 2017, Solana was officially launched in March 2020 by the Solana Foundation with headquarters in Geneva, Switzerland. The SOL protocol is designed to facilitate decentralized app (DApp) creation. It aims to improve scalability by introducing a proof-of-history (PoH) consensus combined with the underlying proof-of-stake (PoS) consensus of the blockchain.
Because of the innovative hybrid consensus model, Solana enjoys interest from small-time traders and institutional traders alike. A significant focus for the Solana Foundation is to make decentralized finance accessible on a larger scale.
Let us look at the technical analysis of SOL.
Past Performance
During the previous week, SOL saw low movements from a central price of $202.23. It has been forming valleys and peaks around this price and broke the resistance of $208.45. It has been moving around the price of $211. This is also to ensure no shorting reduces the price. Over $58 million worth of SOL trades were liquidated yesterday, of which $44 million or 76% came via ‘shorts’ alone. Liquidations, for the uninitiated, occur when leveraged positions are automatically closed out by exchanges/brokerages as a “safety mechanism.”
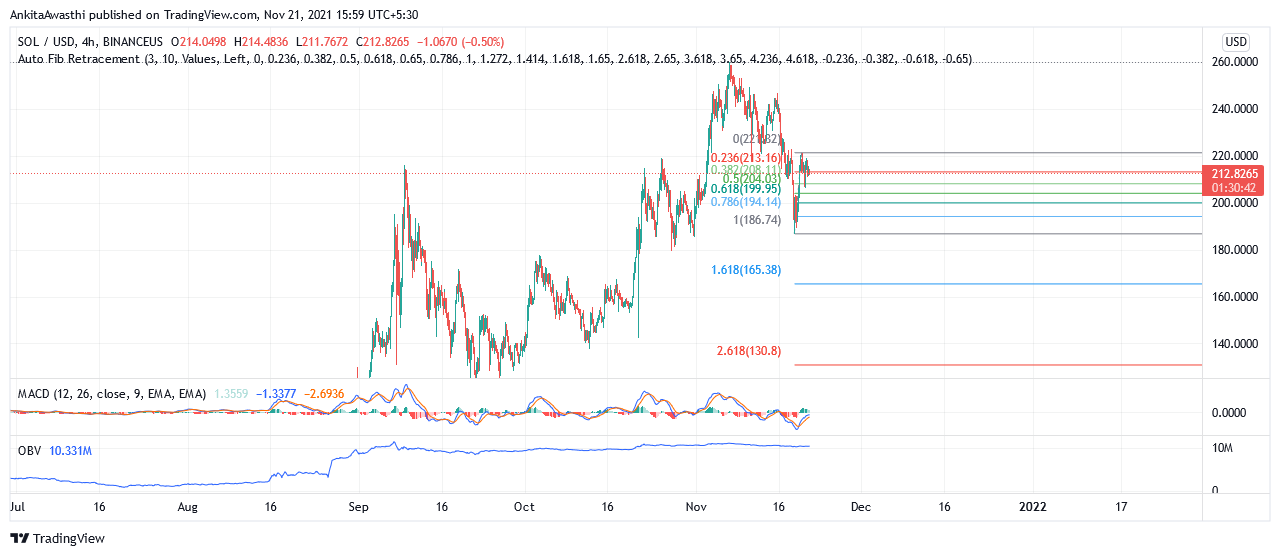
Source: https://www.tradingview.com/x/FecA6dha/
SOL Technical Analysis
The technicals have been giving a sense of neutral returns on a short-term basis of three to four days and an uptrend for the medium and long-term basis as one can see the increase in the pricing of the coin.
The OBV (On Balance Volume) is indicated to be flat, indicating that volume on up days is equal to volume on down days. Hence, demand from buyers and supply from sellers are in equilibrium. However, since the last few weeks, one can see the flatness at an increased level of volume, which shows the interest has increased slowly and steadily and might be the case going ahead as well.
The various support zones are $202.1, $205.5, and $210.5. The nearest resistance zones are $215.10, $218.3, and $221.23.
The RSI has been sitting at 50% for a few hours, showing a flat pace of price movement, which can move in either direction.
Watch out for these different support pivots to see the directional view for the next two days.
The MACD graph has not recovered from the bearish crossover yet, but both the lines are moving upwards. This is showing a divergence of the MACD graph from the price chart, which is a strong bullish signal. The traders may consider taking a long position if the price increases beyond the current resistance at $211.12.
The price is expected to move out of this resistance zone soon enough if this signal stays strong.
Is Solana a Good Investment?
Solana was trading around $6 at the beginning of 2021 and has today moved to almost $200! This certainly shows a great demand for the coin and its blockchain's potential.
The rise of SOL was stalled after it faced a five-hour-long network outage on Tuesday. After the network outage, Solana has not been able to recover. Its network effects seem to have weighed down on itself. However, one can easily see SOL as one of the best performing cryptocurrencies for a long time, almost at par with Ethereum. It has also made particular advancements with NFTs with institutional investors moving to SOL as a reliable investment.