- The price has been lowered to $2.038.
- Fantom price analysis favors the bears.
- Support is still stable at $1.903.
The latest Fantom price analysis is confirming a bearish trend for the day as more selling activity has been taking place for the past few days. Although the bulls tried to make a comeback amidst the bearish swing, the most recent price movement has been bearish. The price has decreased up to $2.04 because of the downward trend and further decline in FTM/USD value is to follow if the sellers remain persistent.
FTM/USD 1-day price chart: Cryptocurrency devalues up to $2.04 after rapid decline
The one-day Fantom price analysis is showing signs of a downtrend today as the price has undergone a major decline in the last 24-hours. The bears are leading the market once again as the past few days have yet again proved favorable for the bears. The price has leveled down to $2.04 as a result of the latest bearish trend. The moving average (MA) value is still quite higher i.e. $2.26 as the price underwent a significant decline in the past few weeks.
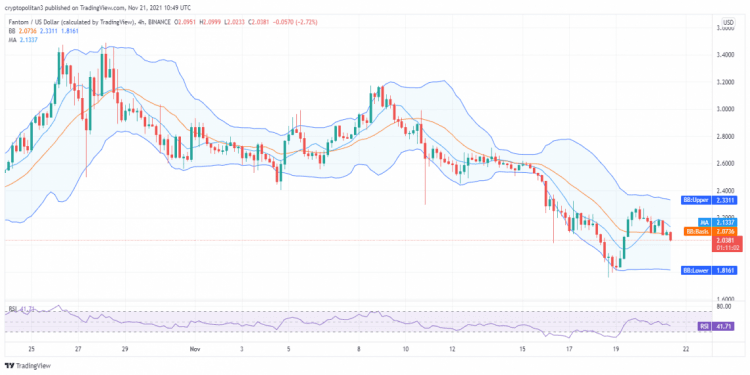
The Bollinger band average in the four hours price chart has decreased up to $2.074. Whereas the upper Bollinger band has now moved towards the $2.331 position and the lower Bollinger band has moved to the $1.82 mark. The RSI curve has taken a downturn in the last four hours and the score is now 41.71.
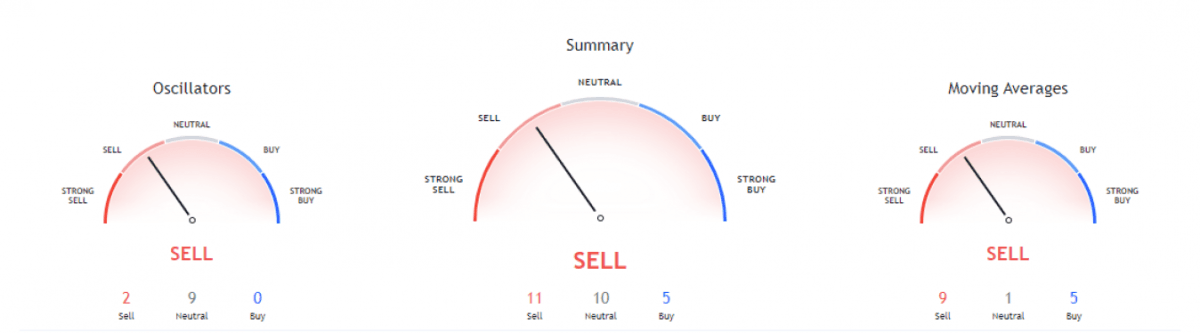
A strong depreciation in FTM/USD market value has been observed over the period of the last few months. This is the reason why the technical indicators chart is giving out a selling indication for the cryptocurrency. A total of 11 indicators are on the selling position, while 10 indicators are on the neutral position and only five indicators are on the buying position.
The Moving Averages Indicator is showing favorable results for the sellers as well. We can see that nine indicators are standing on the selling mark, one indicator is on the neutral mark while five indicators are on the buying mark. The Oscillators are also giving a bearish indication and nine oscillators are on the neutral position, two indicators are on the selling position while zero indicators are on the buying position.
Fantom price analysis conclusion
The hourly, as well as daily Fantom price analysis, are going in the favor of the bears. A strong bearish trend has been dominating the market for a while, and a drop in cryptocurrency’s value has been observed today as well. The price is now $2.04 and is expected to move down to further lows if the current trend continues in the future.
Disclaimer. The information provided is not trading advice. Cryptopolitan.com holds no liability for any investments made based on the information provided on this page. We strongly recommend independent research and/or consultation with a qualified professional before making any investment decisions.