Chainlink and Band Protocol prices are in consolidation within bear patterns. Nonetheless, LINK and BAND are firm above $20 and $7, respectively.
Chainlink (LINK)
The protocol is the largest middleware linking smart contracts with external data using LINK as the main currency.
Past Performance of LINK
The Chainlink crypto is dropping and sellers are in charge.
Still, on the bigger picture, LINK technical analysis suggests strength. Notably, LINK/USDT prices are in range inside a $15 zone.
Day-Ahead and What to Expect
From the daily chart, LINK crypto prices are under pressure.
The failure of buyers to reverse losses could specifically spell doom for the LINK token as we advance.
LINK coin prices have resistance at $35 while support lies at $20.
Currently, LINKUSDT prices are in range, printing lower lows inside the September 2021 trade range.
Chainlink Technical Analysis
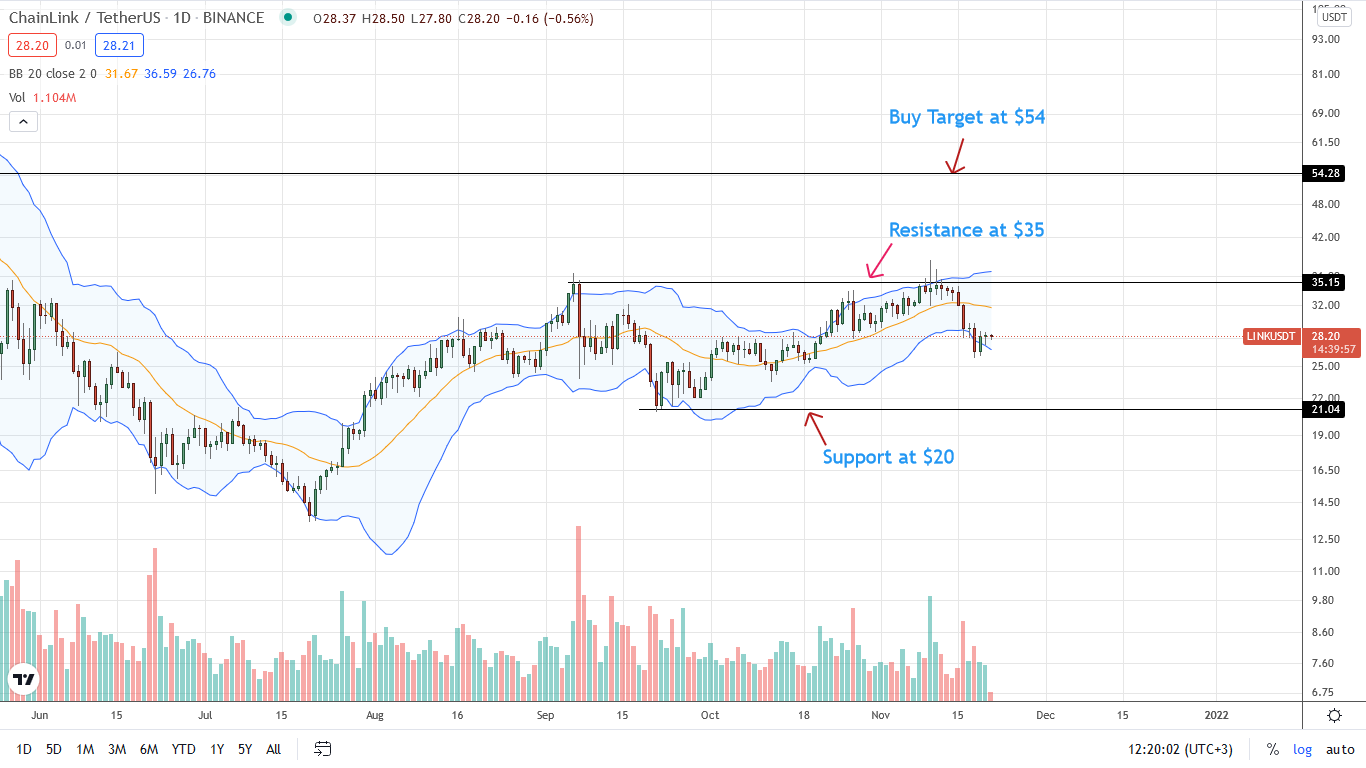
LINKUSDT prices may force an M-formation if sellers press lower below $35.
Since LINK coin bear bars are along the lower BB, pointing to increasing sell momentum, traders may find entries on highs to sell, targeting this week's lows of around $25 and later $20.
However, gains above $30 may form the base for a recovery towards $35.
Band Protocol
The multi-chain oracle provider relies on BAND tokens.
Past Performance of BAND
The Band Protocol crypto is consolidating above $7 and within the September 2021 range.
Losses have not been deep though BAND technical analysis points to weakness and possibly dips in subsequent sessions.
Day-Ahead and What to Expect
The path of the least resistance remains southwards despite the bounce of BAND token prices from the primary support at $7.
Sustained gains towards $11, confirming the rebound of this weekend, could mean further expansions next week.
Still, risk-averse traders may have to wait until there is a clear trend definition.
Band Protocol Technical Analysis
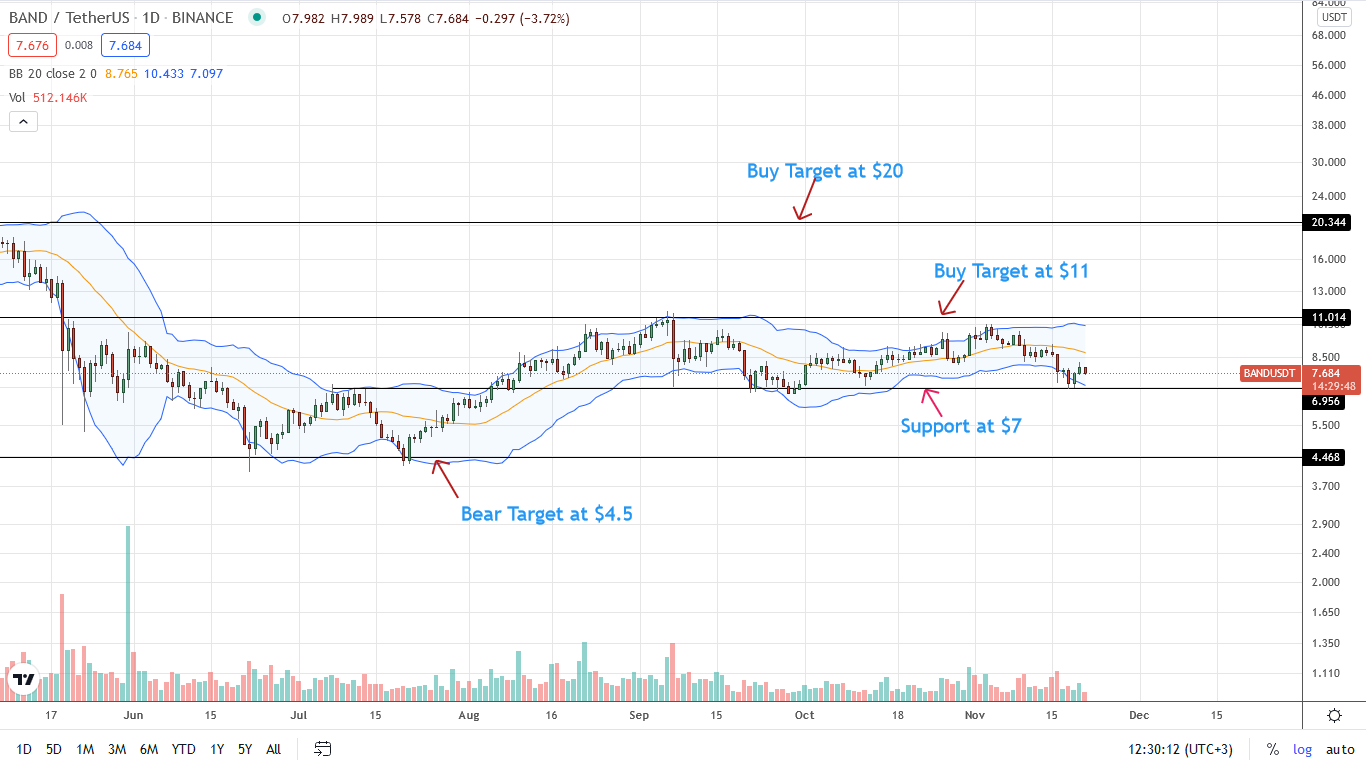
From the daily chart of the BANDUSDT, prices are in range mode even with gains of November 19 and 20.
A high-volume dip below $7 may see BAND coin prices slide to Q3 2021 lows of around $4.5.
On the flip side, a recovery, confirming recent buying pressure, may see BAND prices expand to $11.
The determining move in all this is the level of participation.
As such, the trend-defining bar should preferably be with high trading volumes surpassing recent averages, cracking above or below immediate resistance or support lines.