- Litecoin price analysis is bullish today.
- Support for LTC is present at $207.
- Resistance is found at $229.
The Litecoin price analysis is on the bullish side today. Bulls have recovered a good range from $218 to $221 today. The bullish momentum that started yesterday helped in elevating the price from $203 to the current price level. Today a high swing towards $224.9 was also observed at one point.
The support for LTC is present at $207, followed by another support of $197.8. In contrast, resistance for LTC is present at $229, followed by another resistance of $262. The coin has lost significant value after reaching $279 on 14th November, as it stooped as low as 204 on 18th November. The damage observed was weighty enough, but the coin has also shown some noteworthy recovery from yesterday as well.
LTC/USD 1-day price chart: LTC bulls gain 5.40 percent
The 1-day price chart for Litecoin price analysis shows that the present bullish momentum has yielded good results as LTC is now trading at $221.7 at the time of writing, as today is the second day of the bullish trend. Overall, LTC gained a value of 5.4 percent over the last 24 hours but has lost a tremendous value of 11.5 percent over the past week. Despite the uptrend from yesterday, the trading volume has decreased by 24.3 percent.
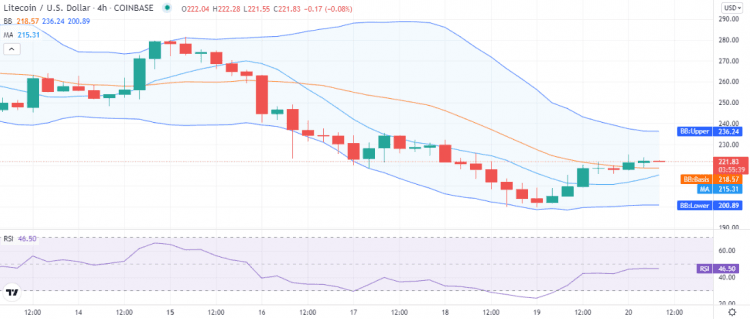
The volatility is mildly high on the 4-hour chart, with the upper Bollinger band at the $236 mark representing the resistance level for LTC/USD, and the lower band is at the $200 mark. The mean average of the indicator at $218 shows first inline support for LTC in case the reversal continues. The RSI is trading at a horizontal curve at index 46 and does not issue any signal.
The technical indicators for LTC are on the bullish side as well. There are 11 indicators hinting at the buying of LTC assets and around six technical indicators hinting at the selling of assets. Around nine technical indicators stand neutral and do not favor any side of the market.
Litecoin price analysis conclusion
The Litecoin price analysis suggests the crypto pair is overall bullish, and the price is on an upwards trend. However, the 4-hour chart shows some selling pressure building up as the last candlestick is red, and the RSI also shows a slow down in the buying as well. On the other hand, as the technical indicators also suggest, the momentum is towards the upside, and if bulls gather enough support, they can still push through towards the $225 level.
Disclaimer. The information provided is not trading advice. Cryptopolitan.com holds no liability for any investments made based on the information provided on this page. We strongly recommend independent research and/or consultation with a qualified professional before making any investment decisions.