Keep Network prices are firm as KEEP is within a bullish breakout pattern above $0.65. On the other hand, sellers may force Synthetix and SNX to $7.
Keep Network
The platform is incentivized to allow the storage of encrypted and private data on the public chain using KEEP.
Past Performance of KEEP
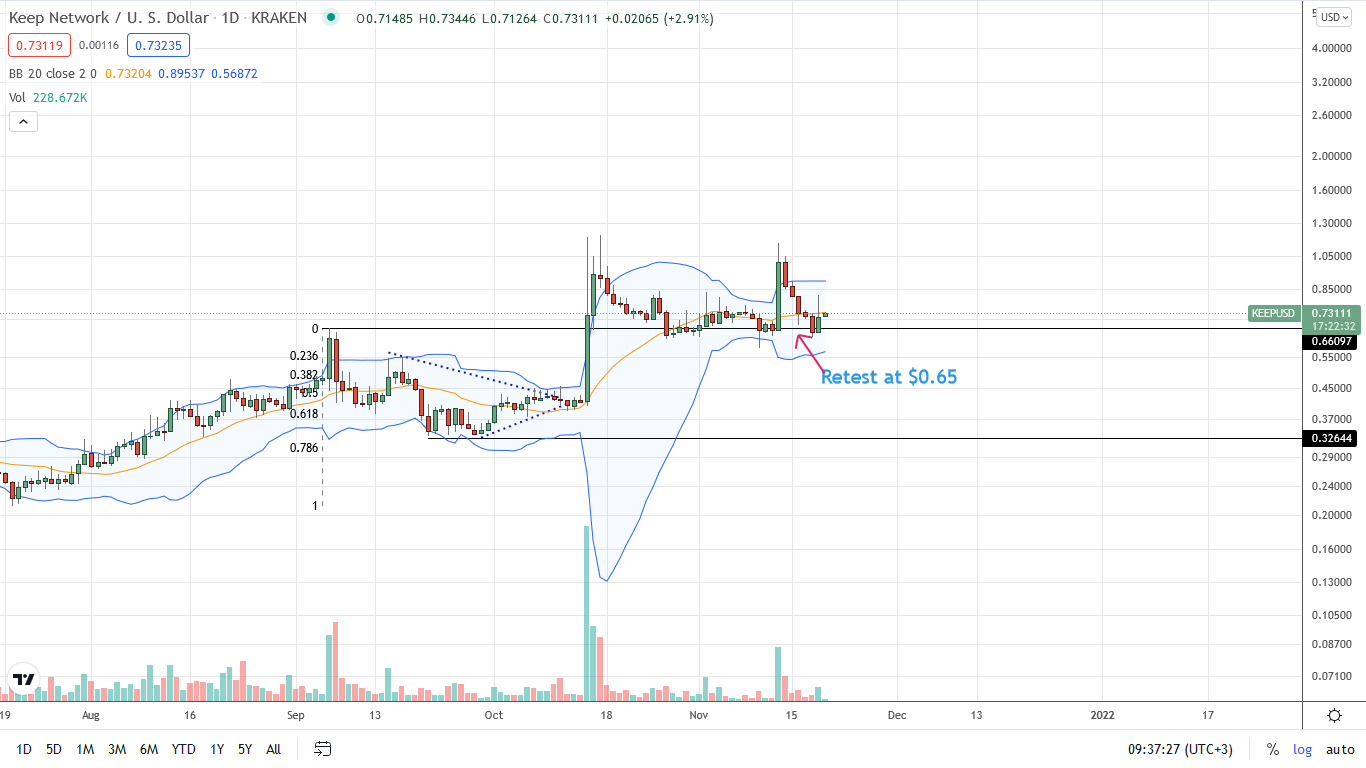
The Keep Network coin is trading within a bullish breakout pattern, rejecting lower lows as per the performance in the daily chart.
Day-Ahead and What to Expect
There were fears that KEEP crypto bears would flow back, forcing KEEPUSD below critical support. The uptrend remains firm above $0.65, confirming bulls.
Specifically, KEEP token prices are trending above the multi-week support and within the bullish bar of November 13.
Therefore, as long as KEEPUSD absorbs selling pressure, the coin may spring higher with continuing gains of October.
Keep Network Technical Analysis
The path of the least resistance remains northwards.
From the KEEP technical analysis, the uptrend is firm, and prices are in accumulation mode.
As long as KEEP prices trend above $0.65, aggressive traders may load the dips targeting $1.10—around November 2021 highs.
The uptrend is valid due to bears' failure to break below $0.65, which favors KEEP buyers from a volumes perspective.
Synthetix (SNX)
The platform on Ethereum is for creating synths tracking real-world assets using the SNX token.
Past Performance of SNX
After periods of lower lows, Synthetix token prices are recovering.
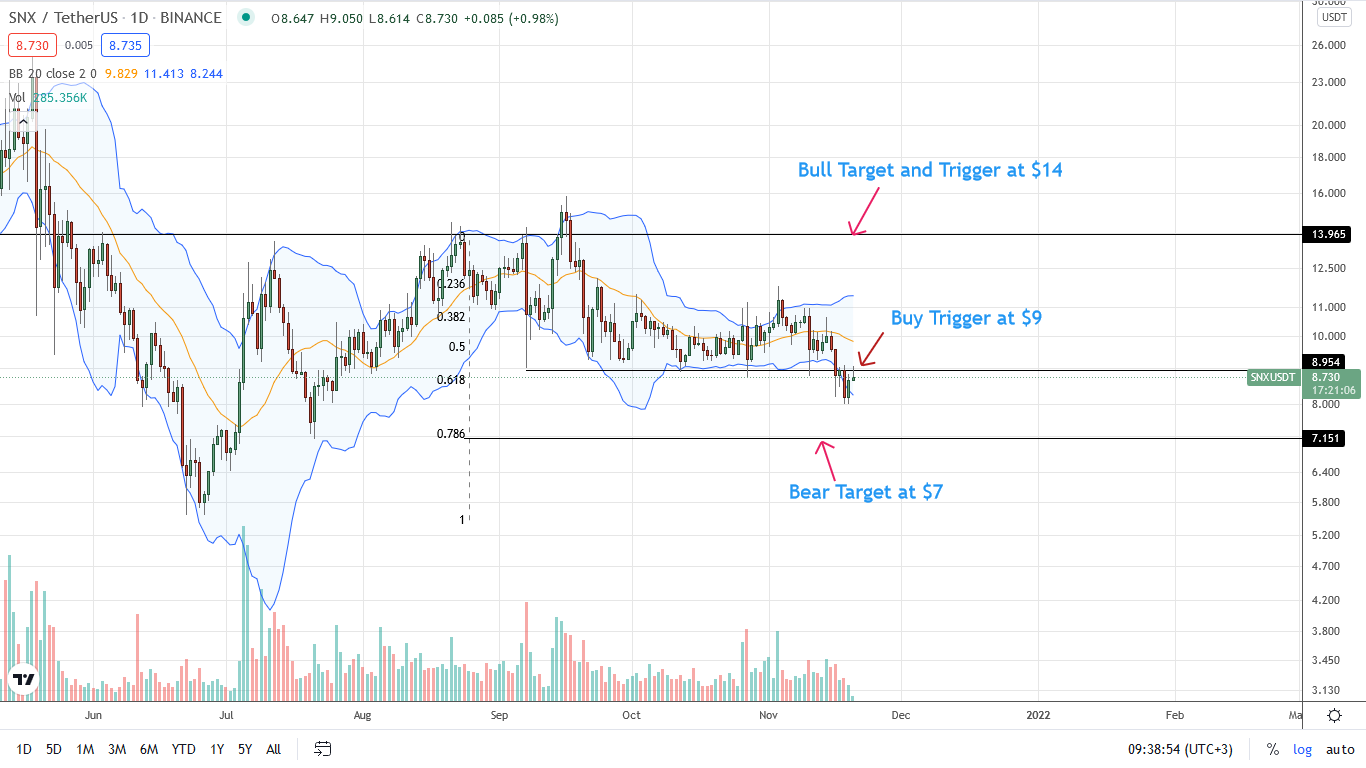
Even so, the SNX crypto is within a bear breakout pattern below $9.
Therefore, this candlestick arrangement swings to favor sellers despite the rejection of lower lows.
Day-Ahead and What to Expect
From the daily chart, SNXUSDT sellers are in control below $9 in a bear breakout pattern.
Even though SNX token prices rose on November 19, every high may offer entries for aggressive SNX traders.
In the short term, SNXUSDT may trend lower to retest $7—which is around the 78.6 percent Fibonacci retracement level of the Q3 2021 trade range.
Synthetix Technical Analysis
There are pockets of weakness from the SNX technical analysis of the daily chart.
After extended losses, SNX prices firmed on November 19.
Even so, this doesn't necessarily signal trend reversal until after SNX coin prices blast above $9.
As it is, every high may be liquidation entries for sellers angling for $7—a potentially critical reaction point flashing with July 2021 lows.