- Bitcoin cash price started a major decline below $650 zone against the US Dollar.
- The price is now trading below the $600 zone and the 55 simple moving average (4-hours).
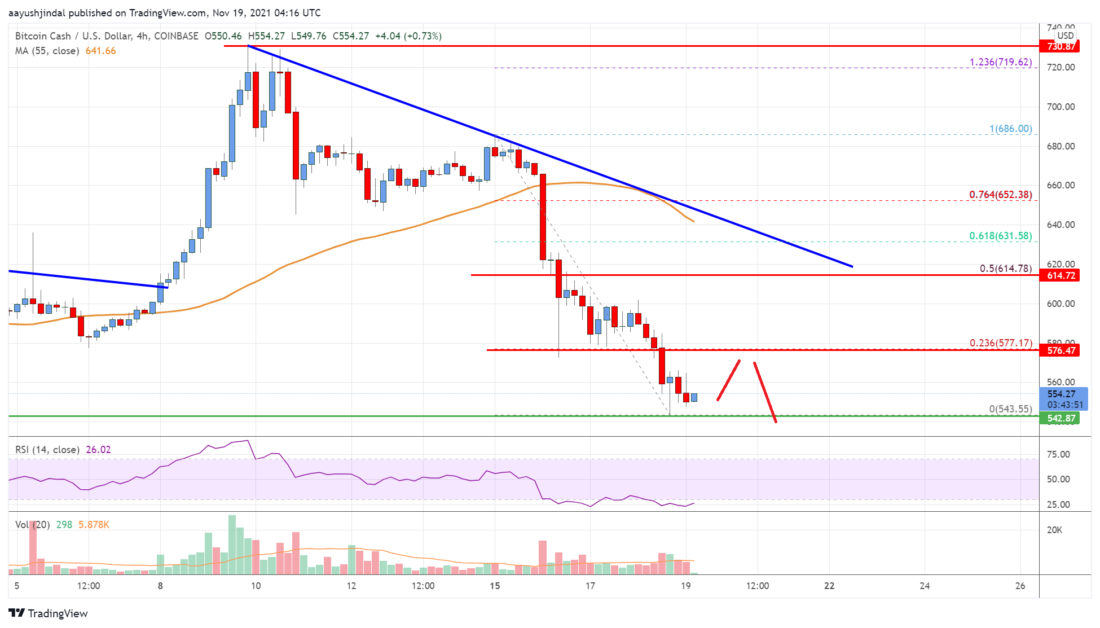
- There is a key bearish trend line forming with resistance near $615 the 4-hours chart of the BCH/USD pair (data feed from Coinbase).
- The pair is consolidating losses there are chances of more downsides below $540 in the near term.
Bitcoin cash price is showing bearish signs below $600 against the US Dollar, similar to bitcoin. BCH/USD could resume its decline if it stays below $600.
Bitcoin Cash Price Analysis
Bitcoin cash price started a major decline after it failed to clear the $700 resistance zone. BCH formed a high near $686 and declined below the $650 support.
The price even broke the $620 support and the 55 simple moving average (4-hours). There was also a break below the $550 level and the price traded as low as $543. It is now consolidating near the $540 level. An immediate resistance is near the $575 level.
It is near the 23.6% Fib retracement level of the recent decline from the $686 swing high to $543 low. The next major resistance could be $600. The main breakout zone is near the $615 level.
There is also a key bearish trend line forming with resistance near $615 the 4-hours chart of the BCH/USD pair. The trend line is also near the 50% Fib retracement level of the recent decline from the $686 swing high to $543 low. A clear break above $600 and $615 might spark a fresh rally.
In the stated case, the price could rise towards the $650 level. An initial support is near the $550 level. The first major support is near the $540 level. The main support is near the $525 level, below which the price could test the $500 support. The next major support is near the $450 level.
Bitcoin Cash Price
Looking at the chart, bitcoin cash price is now trading below the $600 zone and the 55 simple moving average (4-hours). Overall, the price is consolidating losses there are chances of more downsides below $540 in the near term.
Technical indicators
4 hours MACD – The MACD for BCH/USD is slowly gaining pace in the bearish zone.
4 hours RSI (Relative Strength Index) – The RSI for BCH/USD is now below the 50 level.
Key Support Levels – $550 and $540.
Key Resistance Levels – $575 and $600.