- Polkadot price analysis is bullish today.
- Resistance for DOT/USD is present at $40.8.
- Support for DOT/USD is present at $37.3.
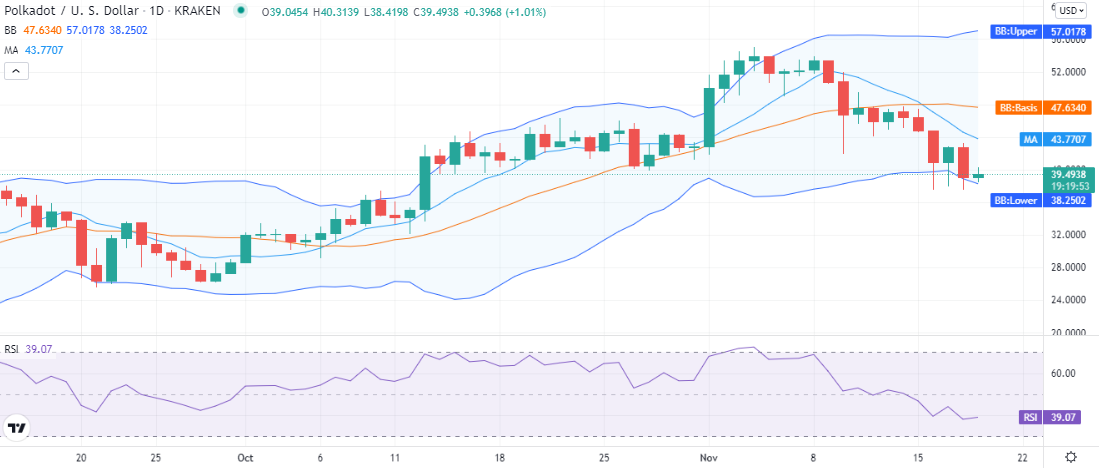
The Polkadot price analysis reveals that the coin rejected further downside below $38.9. The cryptocurrency once again went through a severe loss yesterday, when bears degraded the price further, but today some bullish efforts were made, which enabled DOT/USD to get some stability, and as a result, the last candlestick on the 1-day chart is green.
Overall, Polkadot has been struggling to find support since 9th November, as the trend line is steeply downwards since then, and the coin continues to lose value almost on a daily basis.
DOT/USD 1-day price chart: Bulls struggling for survival
The 24-hour Polkadot price analysis shows that bulls have tried to stop more price devaluation today and have raised the price nominally as the DOT is trading hands at $39.49 at the time of writing. Today bulls have covered a small upwards range from $38.9 to $39.49, which definitely counts when the downtrend is overwhelming. Overall DOT/USD pair went through a loss of 4.5 percent over the last 24 hours and also showed a loss of 16.7 percent over the past week. However, the trading volume went up by 29.4 percent, but the market cap diluted by 6.55 percent.

The already high volatility started increasing further from 17th November, as the Bollinger bands show more divergence now, with the upper band at the $57 mark and the lower band at the $38 mark representing support for DOT/USD, the mean average at the $47.6 mark represents resistance for DOT. The moving average is present above the price level at the $43.7 mark.
The relative strength index (RSI) is found near the undersold region at index 39. The RSI is trading at an almost horizontal line, just at a slightly upwards slope due to today’s bullish progress. RSI indicates the bullish efforts amid high selling pressure.
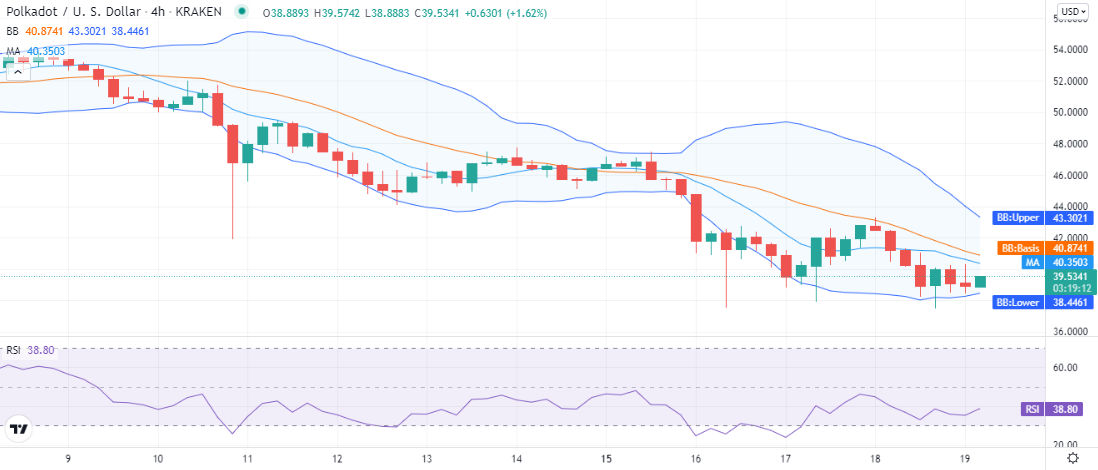
Polkadot price analysis: Recent developments and further technical indications
The 4-hour Polkadot price analysis shows that the price breakout was downwards today as well, but after the first four hours, bulls gained some momentum and tried to elevate the price, which helped recover the price to $39.4.

The volatility is decreasing on the 4-hour chart as the Bollinger bands are converging with the upper band at the $43 mark and the lower band at the $38.4 mark, making an average at the $40.8 mark. The RSI on the 4-hour chart shows an upwards curve trading at index 38, indicating the buying activity in the market.
The technical indicators for Polkadot price analysis are mostly neutral with some inclination towards the bearish side, as eight technical indicators show buying signs and 10 technical indicators show selling signs. The remaining 10 technical indicators stand neutral out of a total of 26 technical indicators.
Polkadot price analysis conclusion
The Polkadot price analysis shows that the coin is recovering today, but the market sentiment is not strongly positive. For proper recovery, DOT needs more support which seems hard to get in the present market circumstances. However, we expect the DOT to continue recovery, at least for today.
Disclaimer. The information provided is not trading advice. Cryptopolitan.com holds no liability for any investments made based on the information provided on this page. We strongly recommend independent research and/or consultation with a qualified professional before making any investment decisions.
 cryptopolitan.com