- Price has improved up to $6.536.
- Theta price analysis favors the bulls.
- Support is still secure at $6.42.
The bulls are struggling for the lead as an increasing trend has been observed in the past 24-hours. The price has heightened up to the $6.536 mark as a result of the bullish efforts. The past few days proved quite detrimental for the market value of THETA/USD, as a bearish swing was on the rise. But now, the buyers are striving for the leading position once again, and so far, their efforts have been fruitful.
THETA/USD 1-day price chart: Price recovers up to $6.54 mark as bulls take action
The one-day Theta price analysis is showing increasing chances of a bullish comeback. An upward trend is being recorded as the bulls are struggling to maintain their upper position. A significant drop in price was recorded in the prior two weeks, as the bearish trend was at its peak. Today, the bulls have allowed the price to rise up to the $6.54 level. The price is still at quite a lower position as compared to its moving average (MA) value i.e. $7.071.
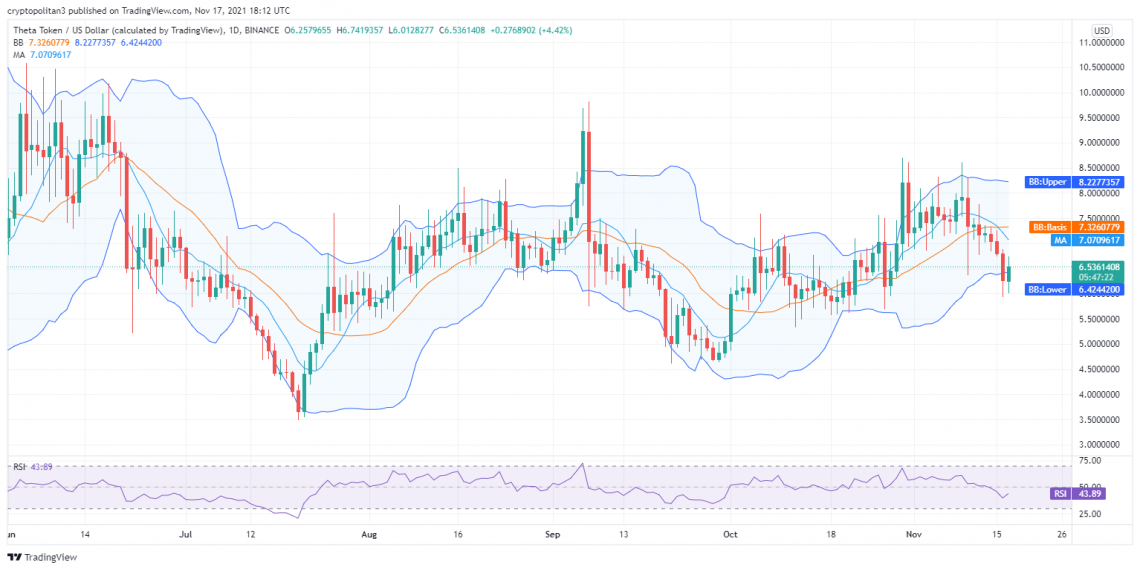
The Bollinger bands average has increased up to $7.34 in the last 24-hours. Whereas the upper value of the Bollinger Bands Indicator is $8.23 while its lower value is $6.42. The Relative Strength Index (RSI) score has improved up to 43.89 as well because of the bullish trend.
Theta price analysis: Cryptocurrency faces unexpected drop at $6.54
The four hours Theta price analysis is confirming a downtrend as a red candlestick is marking loss for the cryptocurrency. Although the price was progressing quite swiftly during the earlier hours, a bearish price movement was observed in the last four hours. The price has dropped down to $6.54 because of the increasing bearish pressure. The moving average value in the four hours price chart is at $6.371 position.
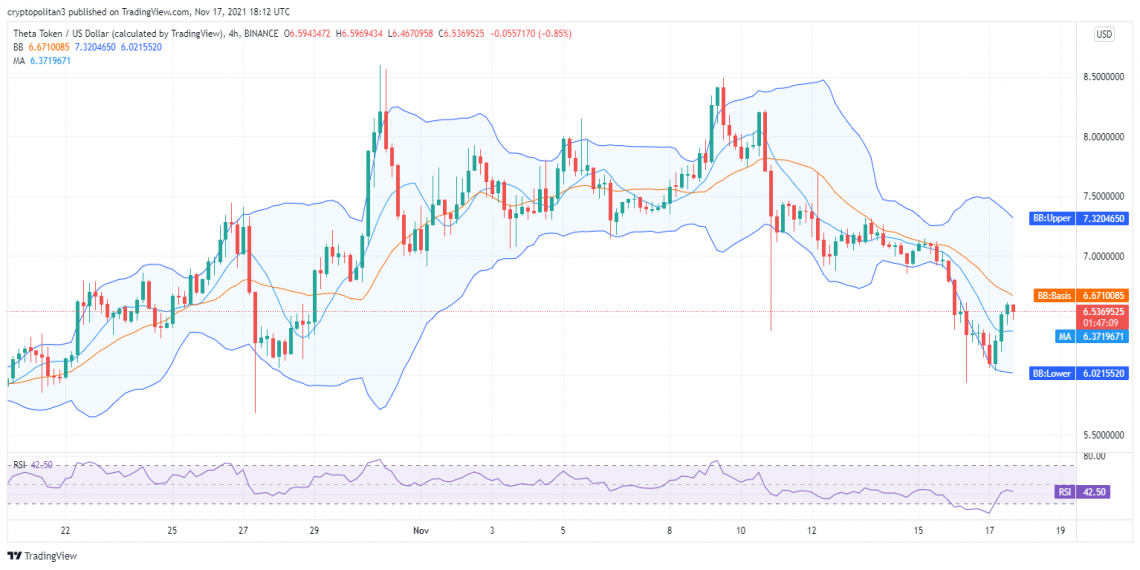
The Bollinger Bands Indicator is showing its average at the $6.671 mark. Whereas its upper band is at $7.32 position while its lower band is at $6.021 position. The SMA 50 curve is still above the SMA 20 curve, which is another indication of the downtrend. The RSI score is in the neutral zone and has increased up to 42.50.
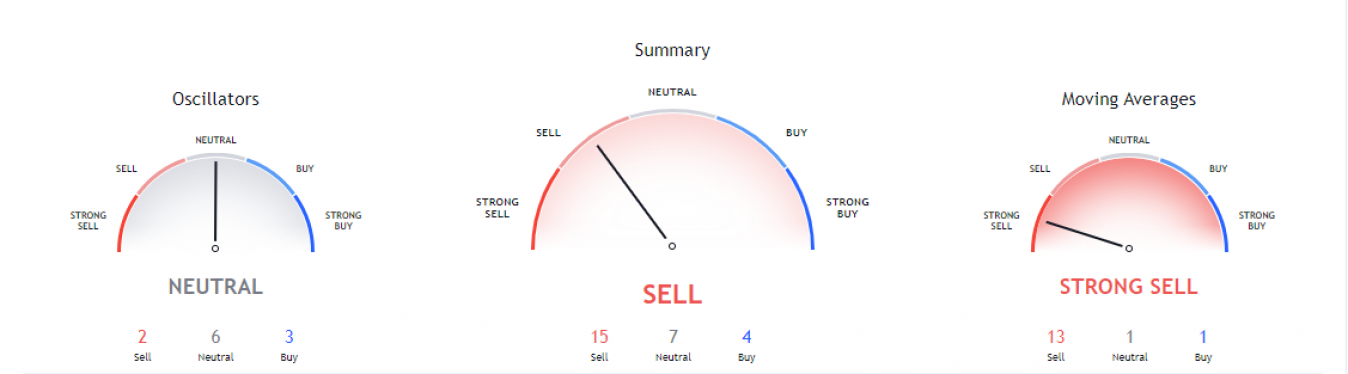
The technical indicators chart for THETA/USD is giving a bearish signal as more selling activity has been observed in the span of the past few months. There are 15 indicators on the selling position, seven indicators are on the neutral position while only four indicators are on the buying position.
The Moving Averages Indicator is showing strong support for the sellers as well. A total number of 13 indicators are on the selling mark while one indicator each is on the neutral and buying marks. The Oscillators are giving a neutral hint for the day as there are six oscillators at the neutral point, three oscillators are at the buying point while only two oscillators are at the selling point.
Theta price analysis conclusion
An improvement in THETA/USD value has been observed during the last 24-hours. The bulls have managed to escape the bearish pressure, and have taken the price above $6.54. On the other hand, the cryptocurrency faced loss in the last four hours, which means that the approaching hours might not be profitable.
Disclaimer. The information provided is not trading advice. Cryptopolitan.com holds no liability for any investments made based on the information provided on this page. We strongly recommend independent research and/or consultation with a qualified professional before making any investment decisions.