Kadena has the only scalable layer 1 PoW blockchain along with Pact, the safest smart contract language. The Kadena token (KDA) is a digital currency that is used to pay for computation on the Kadena public chain. Similar to ETH on Ethereum, KDA on Kadena compensate miners for mining blocks on the network and the transaction fee that users pay in order to have their transactions included in a block.
Let us see how the technical analysis of KDA will stand out.
Past Performance
A 10-day long bull run ended on November 11, 2021, when the trend reversed itself. The past month has witnessed a historic increase in the price, after which a correction can be seen.
The opening trade for KDA on November 10, 2021, took place at $18.18. On November 16, 2021, the price closed at $18.69. Thus, there was a weekly change of 2.8%.
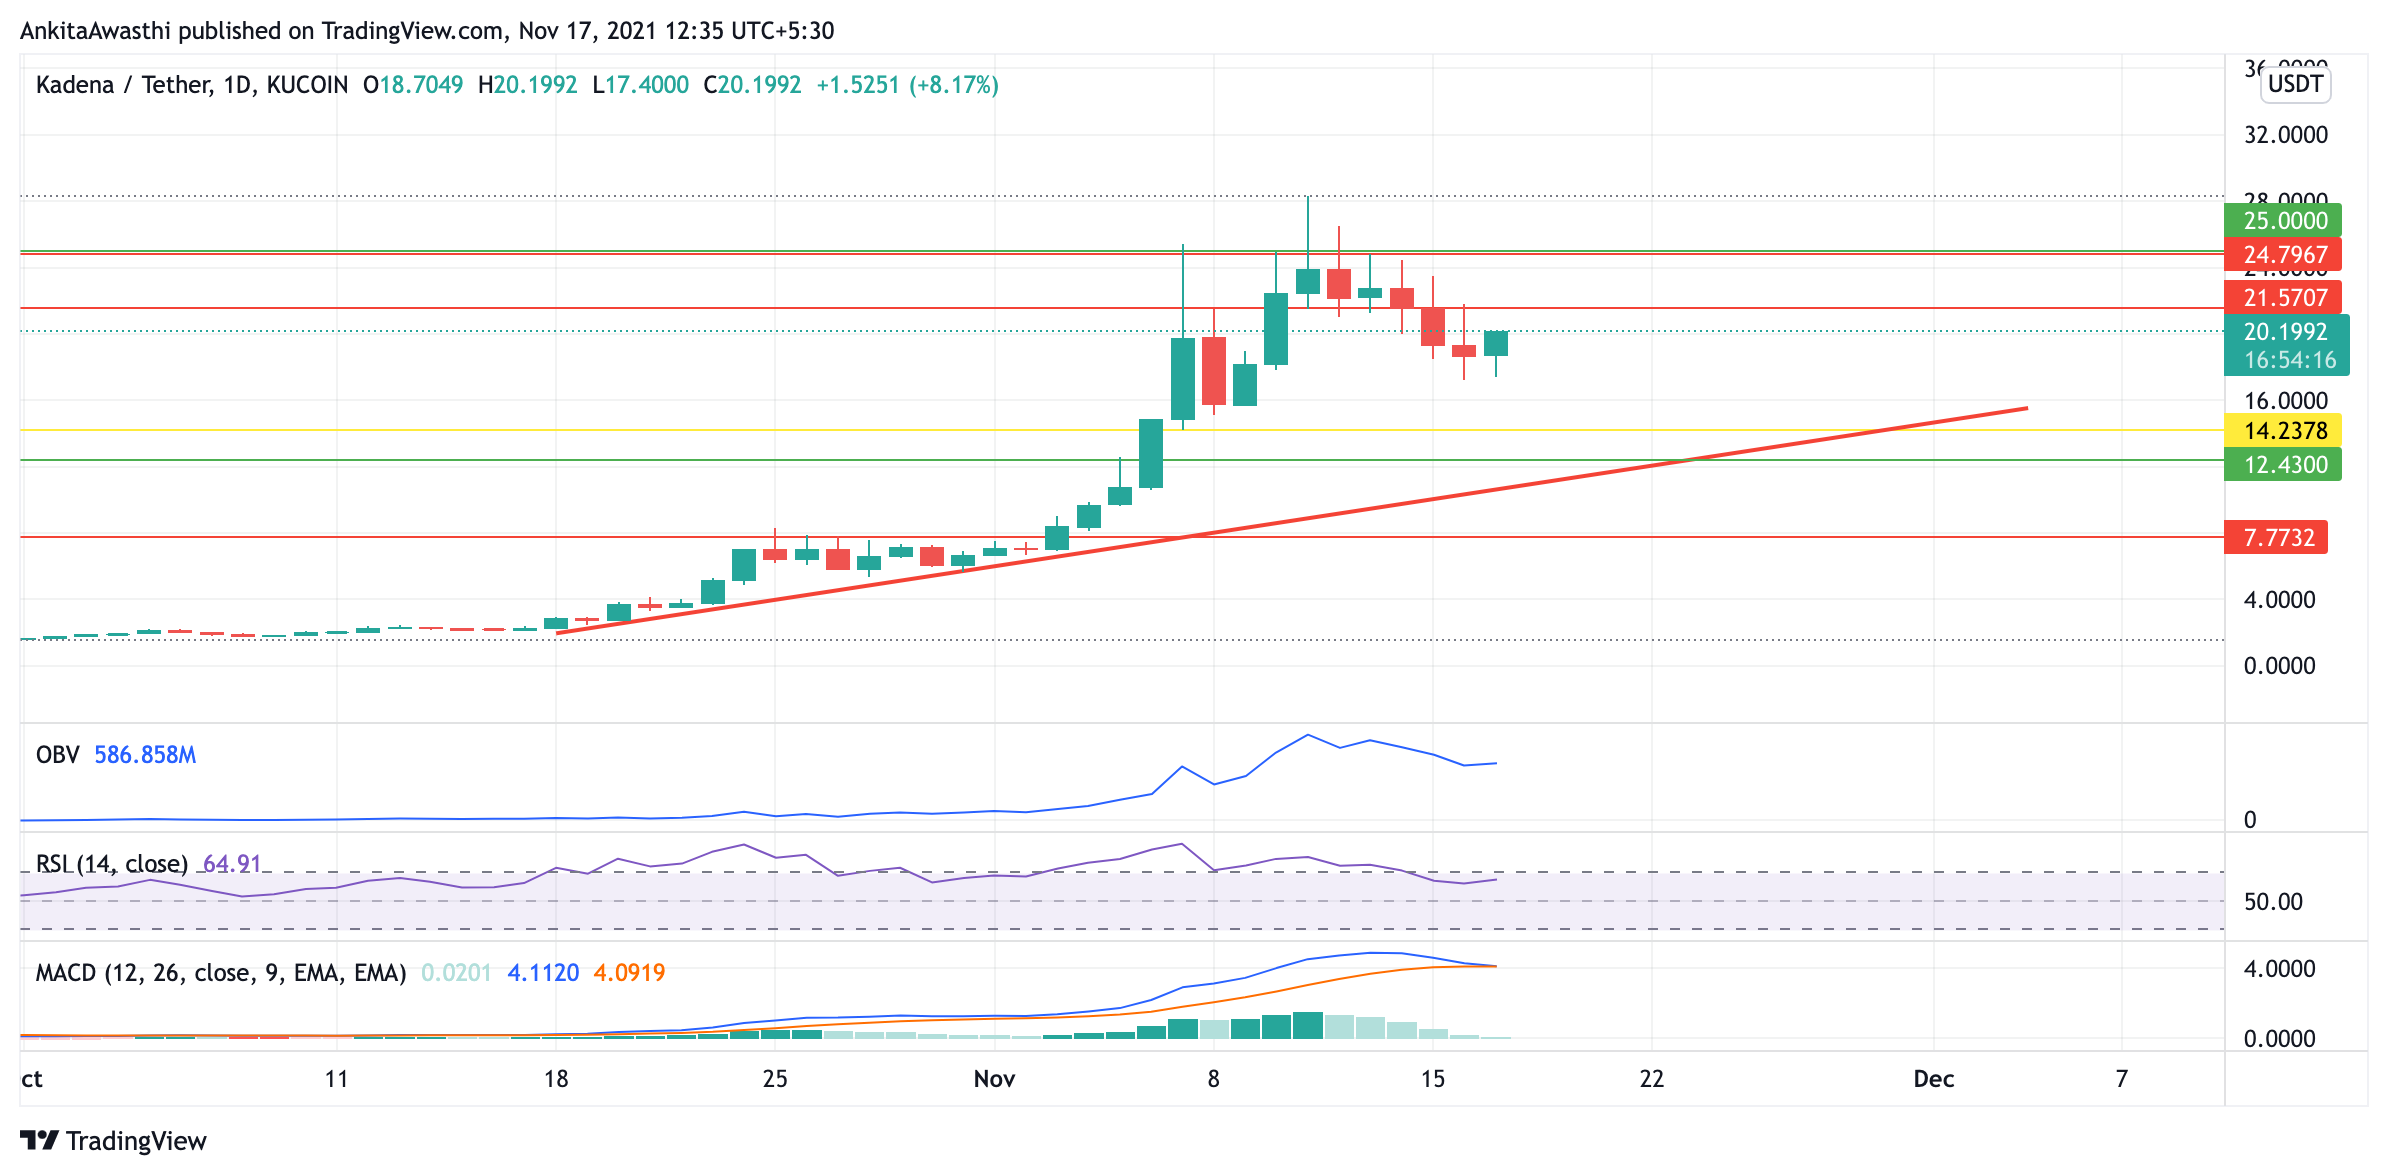
Source: https://www.tradingview.com/x/LHtouAg1/
KDA Technical Analysis
The price chart shows the reversal of the trend. However, today the bulls are driving the price upwards. Currently, KDA is trading around $20.05, which is 7.19% higher than yesterday’s close. Let us look at the indicators to predict future prices.
The OBV is showing that today the bulls are putting pressure on the price to move upwards. This may even result in another trend reversal.
The RSI is showing an upward curve in its graph, which is again a positive signal for the short term. The RSI is currently at the 64.88% mark.
The MACD graph is showing a bearish crossover. This is a signal that the traders may take a short position. Also, there is no divergence from the price and hence less possibility for a trend reversal.
KDA recently launched a wrapped version of its token called wKDA, which operates on the Ethereum network and allows it to interact with all Ethereum Virtual Machine-compatible decentralized finance (DeFi) protocols.
Day-Ahead and Tomorrow
It looks like the coin has benefited from the recent cryptocurrency rally wherein the largest cryptocurrencies in the world traded close to their all-time high, including Bitcoin, Ethereum, and more. The two-month track record of the Kadena coin is impressive for investors.
FIB Retracement shows that the trend reversal took place at the Fib level of $28.3. Currently, the price is being tested at the Fib pivot at $18.02.
Thus, the indicators are giving bullish signals for taking a long position. They can keep a stop-loss at $12.43 while keeping a target at $25. However, looking at the ongoing downtrend, due diligence from long-term investors becomes important.