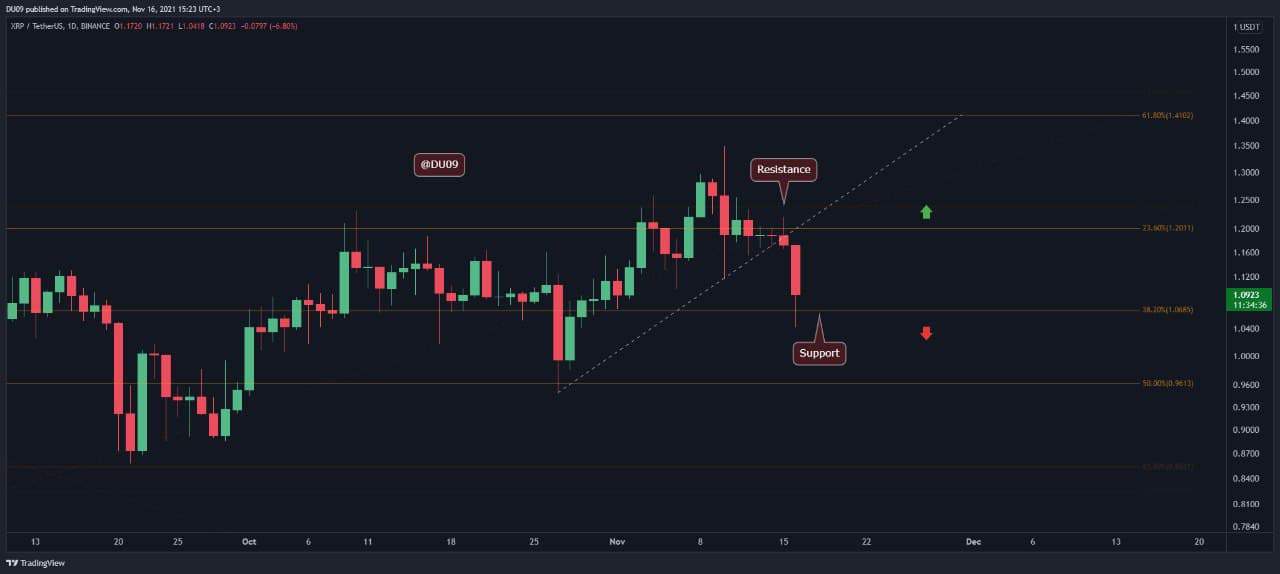
Key Support levels: $1
Key Resistance level: $1.2
Unfortunately, the bulls were unable to sustain the XRP price above $1.2, and it was pushed lower towards the support level at $1 during today’s market downturn. For this reason, the previous support at $1.2 has turned into resistance. $1 remains a strong level, and it would be quite surprising to see the price close below it in the near term.
Technical Indicators
Trading Volume: Volume increased on this drop to the $1 support level. This shows the bears are in control of the price action, but it seems unlikely they can push XRP below $1 as the bulls have defended this level quite well in the past.
RSI: Due to this most recent drop in price, the RSI has taken a nosedive, particularly on the 4-hour timeframe where it has reached the oversold zone, which lies under 30 points. This is bearish.
MACD: Unfortunately, the MACD on the daily timeframe completed a bearish cross two days ago, and today’s cras intensified the drop of the moving averages. Until the histogram makes a higher low, the bias remains bearish.
Bias
The bias is bearish on XRP due to this most recent drop and the fact that the price fell under $1.2. XRP may consolidate around $1 in the near term unless the bears try another push under $1.
Short-Term Prediction for XRP Price
Since the uptrend from last week was reversed, at this time, the best-case scenario for XRP is to hold above $1. A drop below this key support level appears unlikely, but it is too early to be certain as the bears may attempt another push lower, depending on the market conditions.