Summary
- EOS witnessed a 7-day price increase of about 11.30%, bringing its price up to $3.10.
- The cryptocurrency broke above a 6-month old descending price channel this week.
- Against Bitcoin, EOS managed to break above a 5-month old symmetrical triangle pattern as it heads higher.
Key Support & Resistance Levels
EOS/USD
Support: $3.10, $3.00, $2.64.
Resistance: $3.20, $3.40, $3.67.
EOS/BTC:
Support: 0.000373 BTC, 0.000335 BTC, and 0.000316 BTC.
Resistance: 0.000405 BTC, 0.000418 BTC, and 0.000432 BTC.
EOS/USD: Breaks Above 6-Month Old Descending Price Channel!
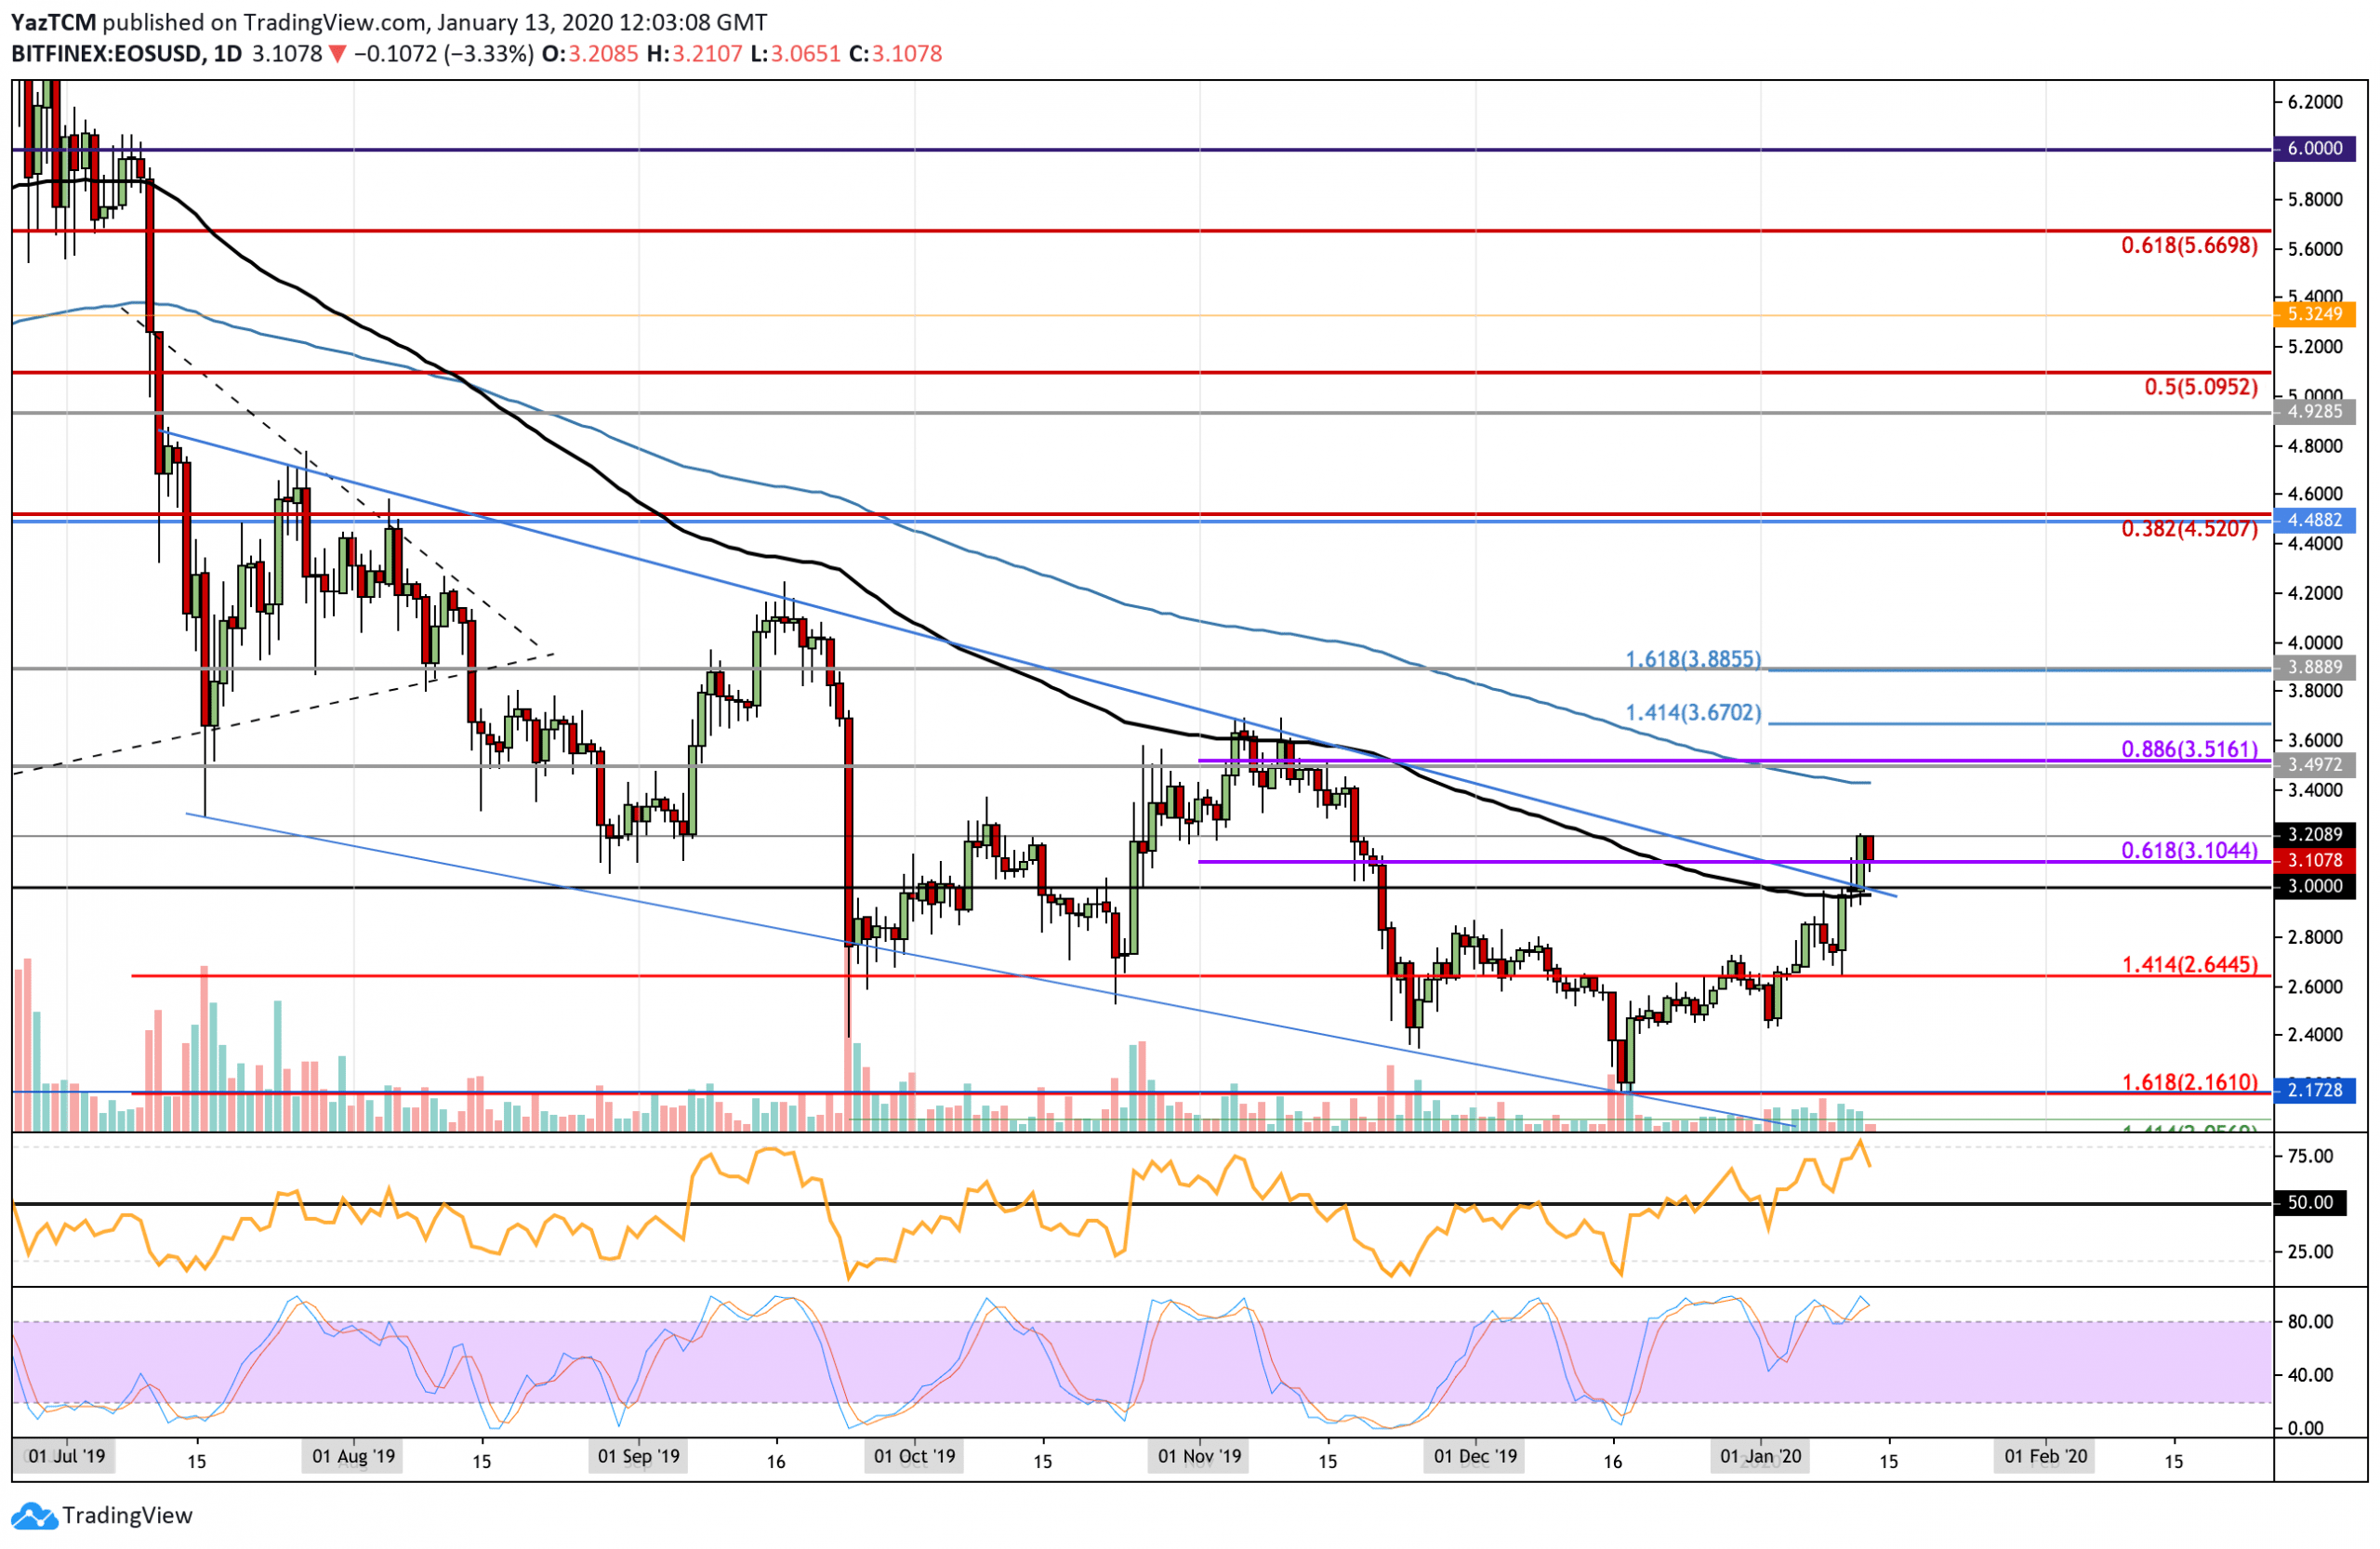
The daily chart above shows EOS rebounding at the $2.16 level, from our last analysis in December. The cryptocurrency continued to rise after that and went on to close the year around the $2.60 level. As 2020 started, EOS continued to climb higher as it broke above the 100-days EMA at around $3.00. It also managed to climb above the 6-month old descending price channel.
In the short term, EOS is now considered to be bullish, however, it still must pass the November high at around $3.60 to turn bullish over the longer period. If EOS was to drop back beneath $3.00 it would turn neutral with a further drop beneath $2.16 turning the market bearish.
EOS Short Term Price Prediction
EOS has met resistance at $3.20 that caused the market to drop slightly in today’s session. However, if the bulls can rebound and climb above $3.20, the next level of resistance lies at $3.40 (200-days EMA). Above this, resistance lies at $3.51, $3.67, and $3.85. Alternatively, if the sellers push EOS beneath the support at $3.10, initial support lies at $3.00. Beneath $3.00, additional support is found at $2.64 and $2.16.
The RSI has pulled back from extreme overbought conditions but still remains in the bullish favor. So long as the RSI can remain above 50 on the pullback, we can expect EOS to continue to make its way toward $3.60. However, the Stochastic RSI is also in overbought conditions and is primed for a bearish crossover signal which could send the market lower. This may suggest that EOS could be a little overextended at the moment and may need to pull back slightly before being able to climb further higher.
EOS/BTC: Breaks Symmetrical Triangle Pattern
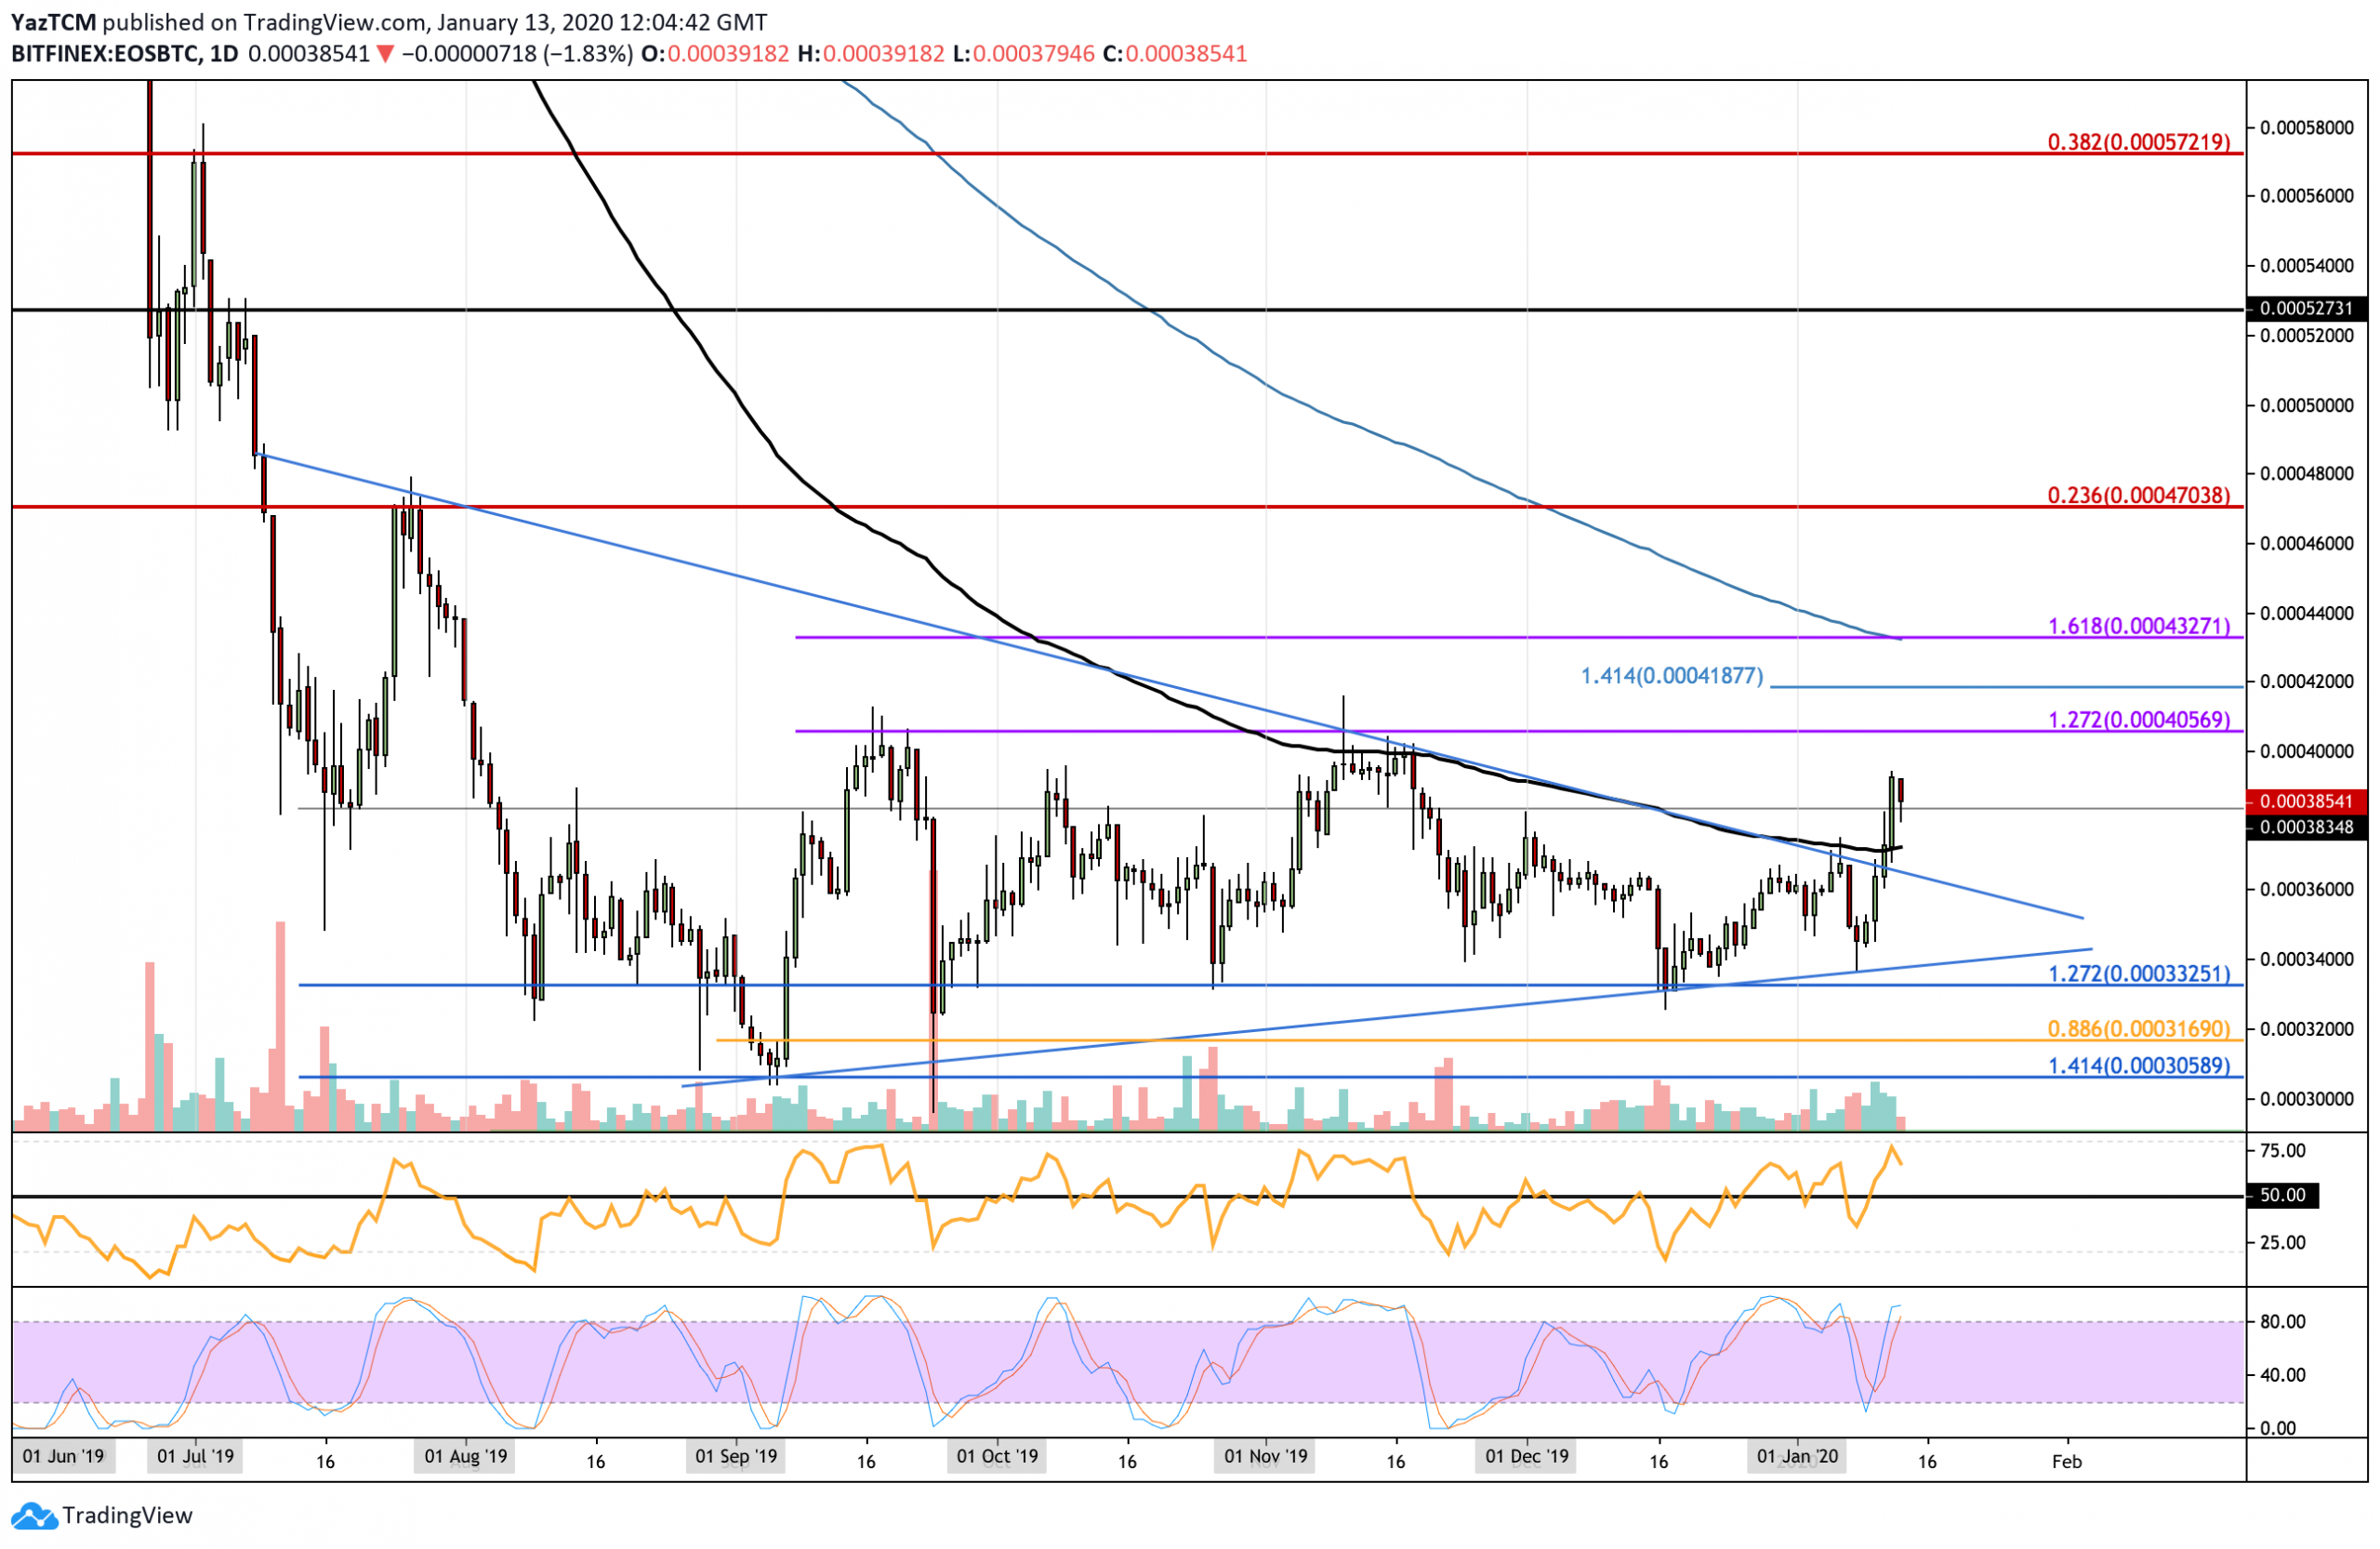
Against Bitcoin, EOS was trapped within a 5-month old symmetrical triangle pattern as it continued to bounce between the 2 boundaries in consolidation. However, this week, EOS managed to break above the upper boundary of the triangle as it approached the apex. EOS continued to breakout higher as it passed above the 100-days EMA to reach the current trading level of 0.000385 BTC.
As EOS broke above the triangle, the market can be considered as bullish in the short term, however, it must break above 0.000405 to have a long term bullish effect. Alternatively, if EOS was to drop beneath 0.00034 BTC, it would turn bearish.
EOS Short Term Price Prediction
If the bulls continue to climb higher from the current support, immediate resistance is to be expected at 0.000405 BTC. This level provided significant resistance for the market during September and November and is expected to provide equal resistance moving forward. Above this, resistance lies at 0.000418 BTC and 0.000432 BTC (also 200-days EMA). On the other hand, if the sellers regroup and push the market lower, initial support is located at the 100-days EMA at around 0.000373 BTC. Beneath this, additional support is found at 0.000335 BTC, and 0.000316 BTC.
The RSI remains within the bull’s favor as it trades above 50. EOS will remain bullish so long as it can remain above 50 on the rebound.