- Polkadot price analysis is bullish today.
- Resistance for DOT/USD is present at $47.5.
- Support for DOT/USD is present at $44.8.
The Polkadot price analysis shows bulls are leading the charts today. The DOT/USD is recovering from yesterday’s loss, but the progress is not remarkable as some resistance is also present around the $47 threshold. However, the support of $44.8 is strong enough to keep the DOT/USD afloat.
Yesterday the bears hindered price progress, but DOT declined further downside when the price reached $46.3. The loss was small, but the gain of today seems much smaller comparatively as price oscillation is slow due to low trading volume.
DOT/USD 1-day price chart: Bulls slow in progress
The Polkadot price analysis shows that the coin is trading at $47 at the time of writing, as the bulls have covered a little upwards range today. The Polkadot price analysis further shows that DOT/USD has gained a nominal value of over 0.5 percent value in the last 24 hours and has lost about 12 percent value over the course of the last seven days. The trading volume is also down by 12.4 percent, and the market cap has suffered by 0.76 percent.
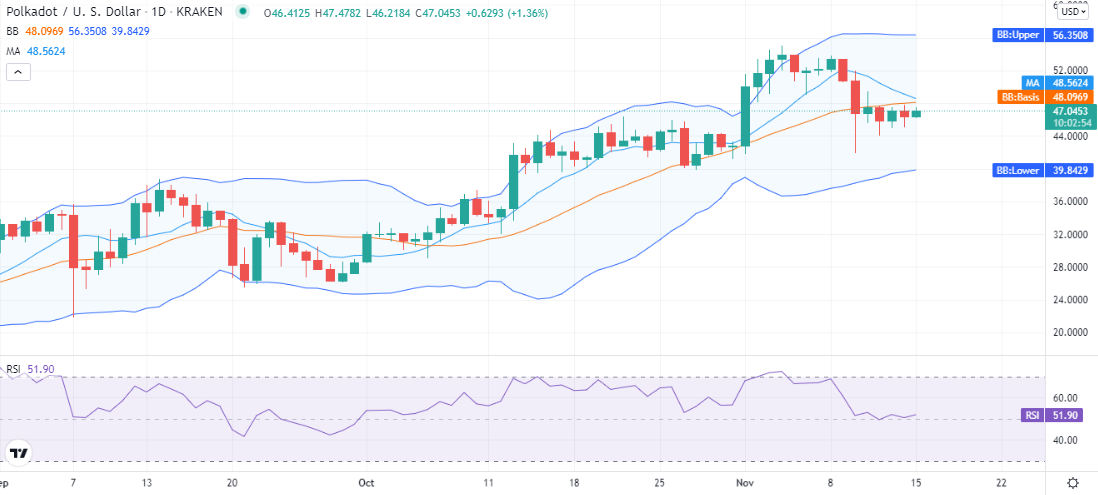
The volatility is high for Polkadot, as the Bollinger bands started expanding on 25th November and still covers a wide area with the upper Bollinger band at the $56 mark and the lower band is at the $39 mark, the average of Bollinger bands is forming at $48 above the price level representing resistance for the coin.
The relative strength index (RSI) is on a slight upwards trend and is present in the upper half of the neutral zone at index 51. This indicates a positive market sentiment for the DOT/USD pair among the traders.
Polkadot price analysis: Recent developments and further technical indications
The 4-hour Polkadot price analysis shows despite the fact that the price has increased, the presence of bearish elements has also been observed, as bearish activity has been observed during the first eight hours, and a deficit in price has happened during the said time frame. But thereon, bulls have again held their position and are trying to uplift the price.
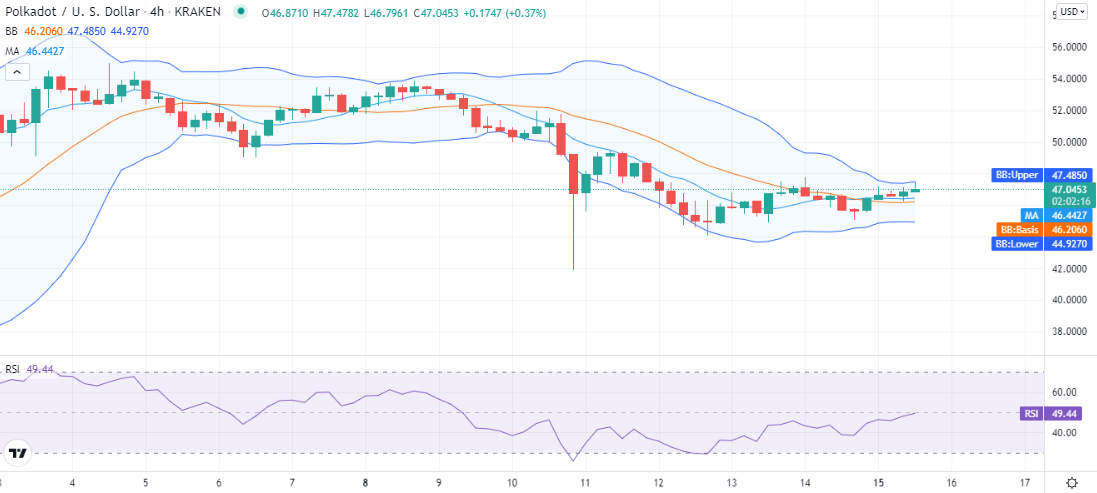
The volatility is low on the 4-hour chart as the Bollinger bands cover less area, and the price is trading below the upper Bollinger band, which represents resistance for the crypto pair. The relative strength index (RSI) is on an upwards trend at the center of the neutral zone and is present at index 49. The moving average is present below the price level at the $46 mark.
By rounding off the technical indicators, most of them are inclined towards the bullish side. Out of a total of 26 technical indicators, 11 suggest buying of DOT/USD assets, and six suggest selling options, thus indicating a bullish trend. At the same time, nine technical indicators stand neutral and do not favor either side of the market.
Polkadot price analysis conclusion
The Polkadot price analysis shows the price oscillation is slow but on the recovering side. As we know, the $47 mark has been a tough point for Polkadot to break through, and bullish momentum is not strong enough at the time. We expect the DOT needs more support from the market for a push towards the higher side.
Disclaimer. The information provided is not trading advice. Cryptopolitan.com holds no liability for any investments made based on the information provided on this page. We strongly recommend independent research and/or consultation with a qualified professional before making any investment decisions.