- Litecoin price analysis is bearish today.
- Support for LTC is present at $262.
- Resistance is found at $294.
The Litecoin price analysis is showing bearish signs today again after rallying high yesterday. LTC/USD was unable to break above the $279 level, and the bearish return suppressed the price function from moving higher. The selling pressure exists at the level of $279, and LTC faced rejection from further upside.
Yesterday a spike in price was observed as the LTC has been highly bullish from the 8th November, but today again, the bears are countering the gains by devaluing the price down as selling pressure is building in the market. Despite the overall bullish trend, yet LTC is correcting again today.
LTC/USD 1-day price chart: LTC encounters selling pressure
The 1-day Litecoin price analysis shows a decline in the price has happened today, and Litecoin is again suffering from loss. Bears diverted the bullish efforts and are trying to restrict the price below the $279 range. The LTC/USD pair is trading hands at $275 at the time of writing. Due to yesterday’s surge in price, the LTC still shows a gain in the value of eight percent over the last 24 hours and an increase in value of more the 32 percent over the past week, as the coin has gained good value during this time. The trading volume, though, is low today but reports a gain of 22 percent over the last day.
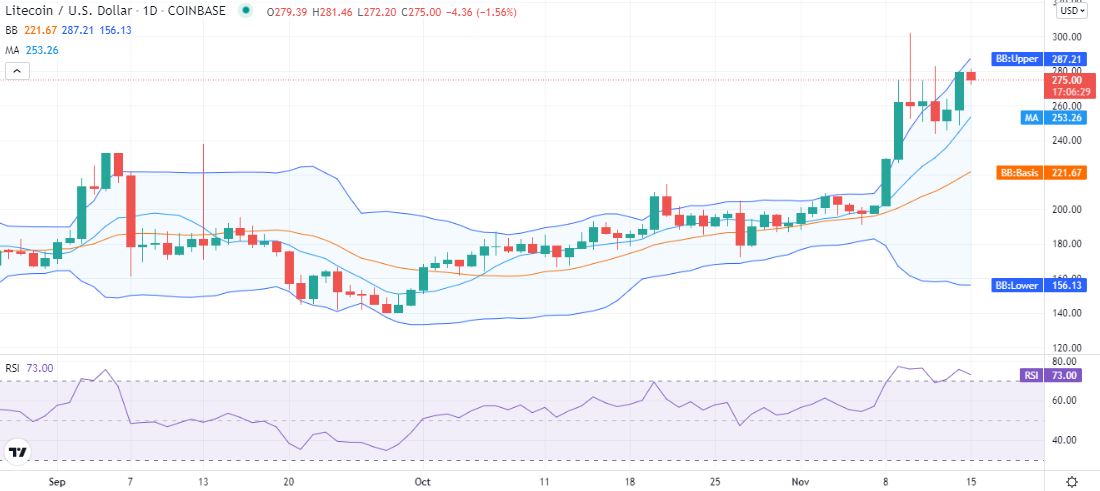
The volatility has been increasing from 8th November and is still prevalent, with Bollinger bands ends widening apart continuously. The upper band is present at the $287 mark, while the lower band is present at the $156 mark, and the mean average is found at the $221 mark below the price level, representing support for the coin.
The relative strength index (RSI) is on a slight downwards slope but still present in the overbought region at index 73, though still on the higher side, the indicator shows the entrance of sellers in the market. The moving average (MA) is found at $253, still far below the price level, complementing the overall bullish scenario for LTC.
Litecoin price analysis: Recent developments and further technical indications
The 4-hour price chart for Litecoin price analysis shows bears have taken over the market today. As the price movement was upwards for 16 hours continuously, but from the start of today’s session, the selling pressure has build-up and is working by lowering the price value, as red candlesticks are appearing on the chart since the start of today’s session. However, the loss is not overwhelming.
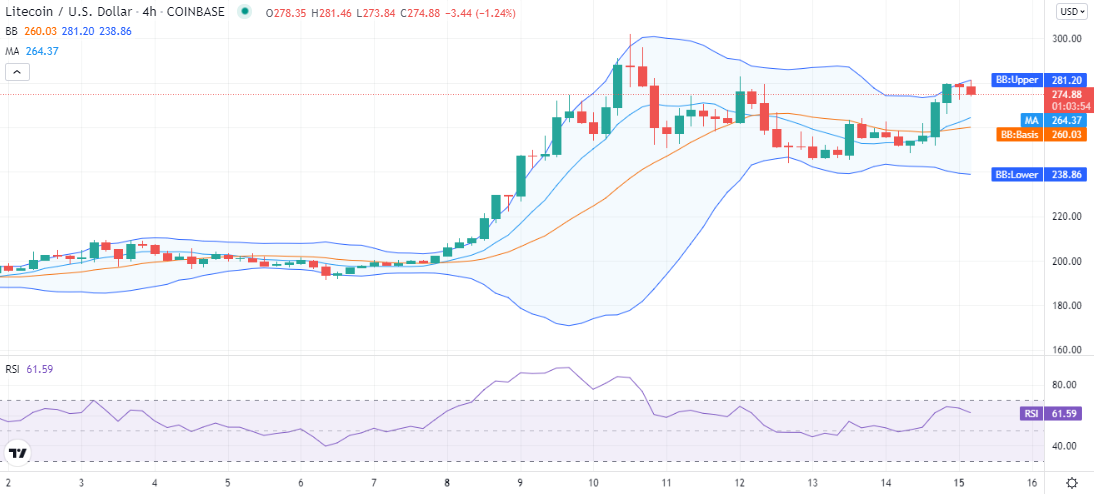
The volatility is high for LTC as Bollinger bands are expanding again, and the price level is going down after crossing above the upper limit of the Bollinger bands yesterday, as the price has traveled below the upper band, it has converted into resistance for LTC at the $281 mark. The RSI has also been decreasing in recent hours and is trading at a downwards slope at index 61.
Litecoin price analysis conclusion
The Litecoin price analysis report shows a devaluation of LTC price, as the price has been lowering for the past eight hours, but the downfall is not steep, and overall, LTC is bullish. The price has come down to $275, and chances are there for a further decrease. A reversal in the current bearish momentum is also possible if support from the bullish side comes in.
Disclaimer. The information provided is not trading advice. Cryptopolitan.com holds no liability for any investments made based on the information provided on this page. We strongly recommend independent research and/or consultation with a qualified professional before making any investment decisions.