- Stellar lumen price is currently consolidating above the $0.0450 support area against the US Dollar.
- XLM price might start a decent increase if it clears the $0.0480 and $0.0500 resistance levels.
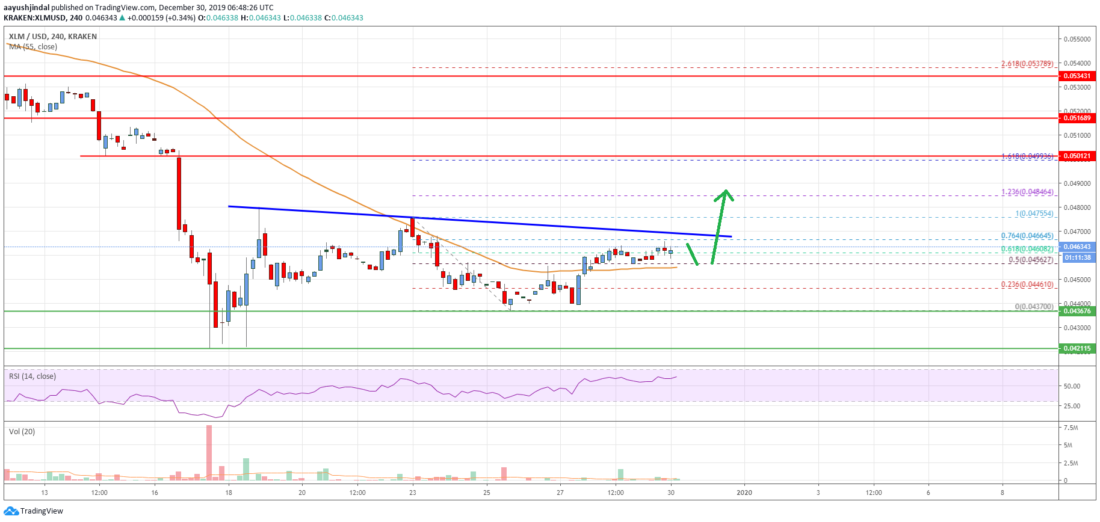
- There is a key bearish trend line forming with resistance near $0.0465 on the 4-hours chart (data feed via Kraken).
- The pair seems to be forming a strong support base near $0.0450 and $0.0435.
Stellar lumen price is sowing positive signs against the US Dollar, while bitcoin is climbing higher. XLM is likely to accelerate above $0.0500 as long as it is above $0.0435.
Stellar Lumen Price Analysis (XLM to USD)
In the past few days, stellar lumen price remained in a broad range below the $0.0480 resistance against the US Dollar. The XLM/USD pair seems to be forming a strong support base near $0.0450 and $0.0435.
The last swing low was near $0.0437 before the price started an upward move. It broke the $0.0450 resistance. Besides, there was a break above the 50% Fibonacci retracement level of the downward move from the $0.0475 high to $0.0437 low.
More importantly, there was a close above the $0.0455 and the 55 simple moving average (4-hours). However, the price is now facing resistance near the $0.0480 area.
Additionally, the 76.4% Fibonacci retracement level of the downward move from the $0.0475 high to $0.0437 low is acting as a resistance. There is also a key bearish trend line forming with resistance near $0.0465 on the 4-hours chart.
Therefore, an upside break above the $0.0475 and $0.0480 resistance levels could open the doors for more gains. The next major resistance is near the $0.0500 level, above which stellar price might start a strong upward move.
In the mentioned case, the price is likely to gain pace above the $0.0520 level. Conversely, the price could struggle to continue higher above the $0.0480 level.
In the bearish scenario, the bears are likely to push the price back towards the $0.0450 and $0.0435 support levels. Any further losses might start a major decline towards the $0.0400 support area, followed by $0.0380.
Stellar Lumen Price
The chart indicates that XLM price is bullish signs above the $0.0435 and $0.0450 support levels. However, the bulls need to gain momentum above the $0.0480 and $0.0500 resistance levels to set the stage for a larger upward move in the near term.
Technical Indicators
4 hours MACD – The MACD for XLM/USD is currently gaining momentum in the bullish zone.
4 hours RSI – The RSI for XLM/USD is now well above the 50 level.
Key Support Levels – $0.0450 and $0.0435.
Key Resistance Levels – $0.0475, $0.0480 and $0.0500.