Kadena has the only scalable layer 1 PoW blockchain along with Pact, the safest smart contract language. The Kadena token (KDA) is a digital currency that is used to pay for computation on the Kadena public chain.
Kadena has recently made an announcement for its new mining client, “We’re excited to announce the release of Kadena's Chainweb-Mining-Client! This software allows miners to mine to their own nodes, without going through a pool, mitigating centralization within pool servers.”
Let us look at the technical analysis of KDA.
Past Performance
KDA opened for trading at $7.02 on November 3, 2021. The week witnessed a parabolic increase in the price, and finally, it closed at $18.15 on November 9, 2021. This was a weekly change of 158.54%.
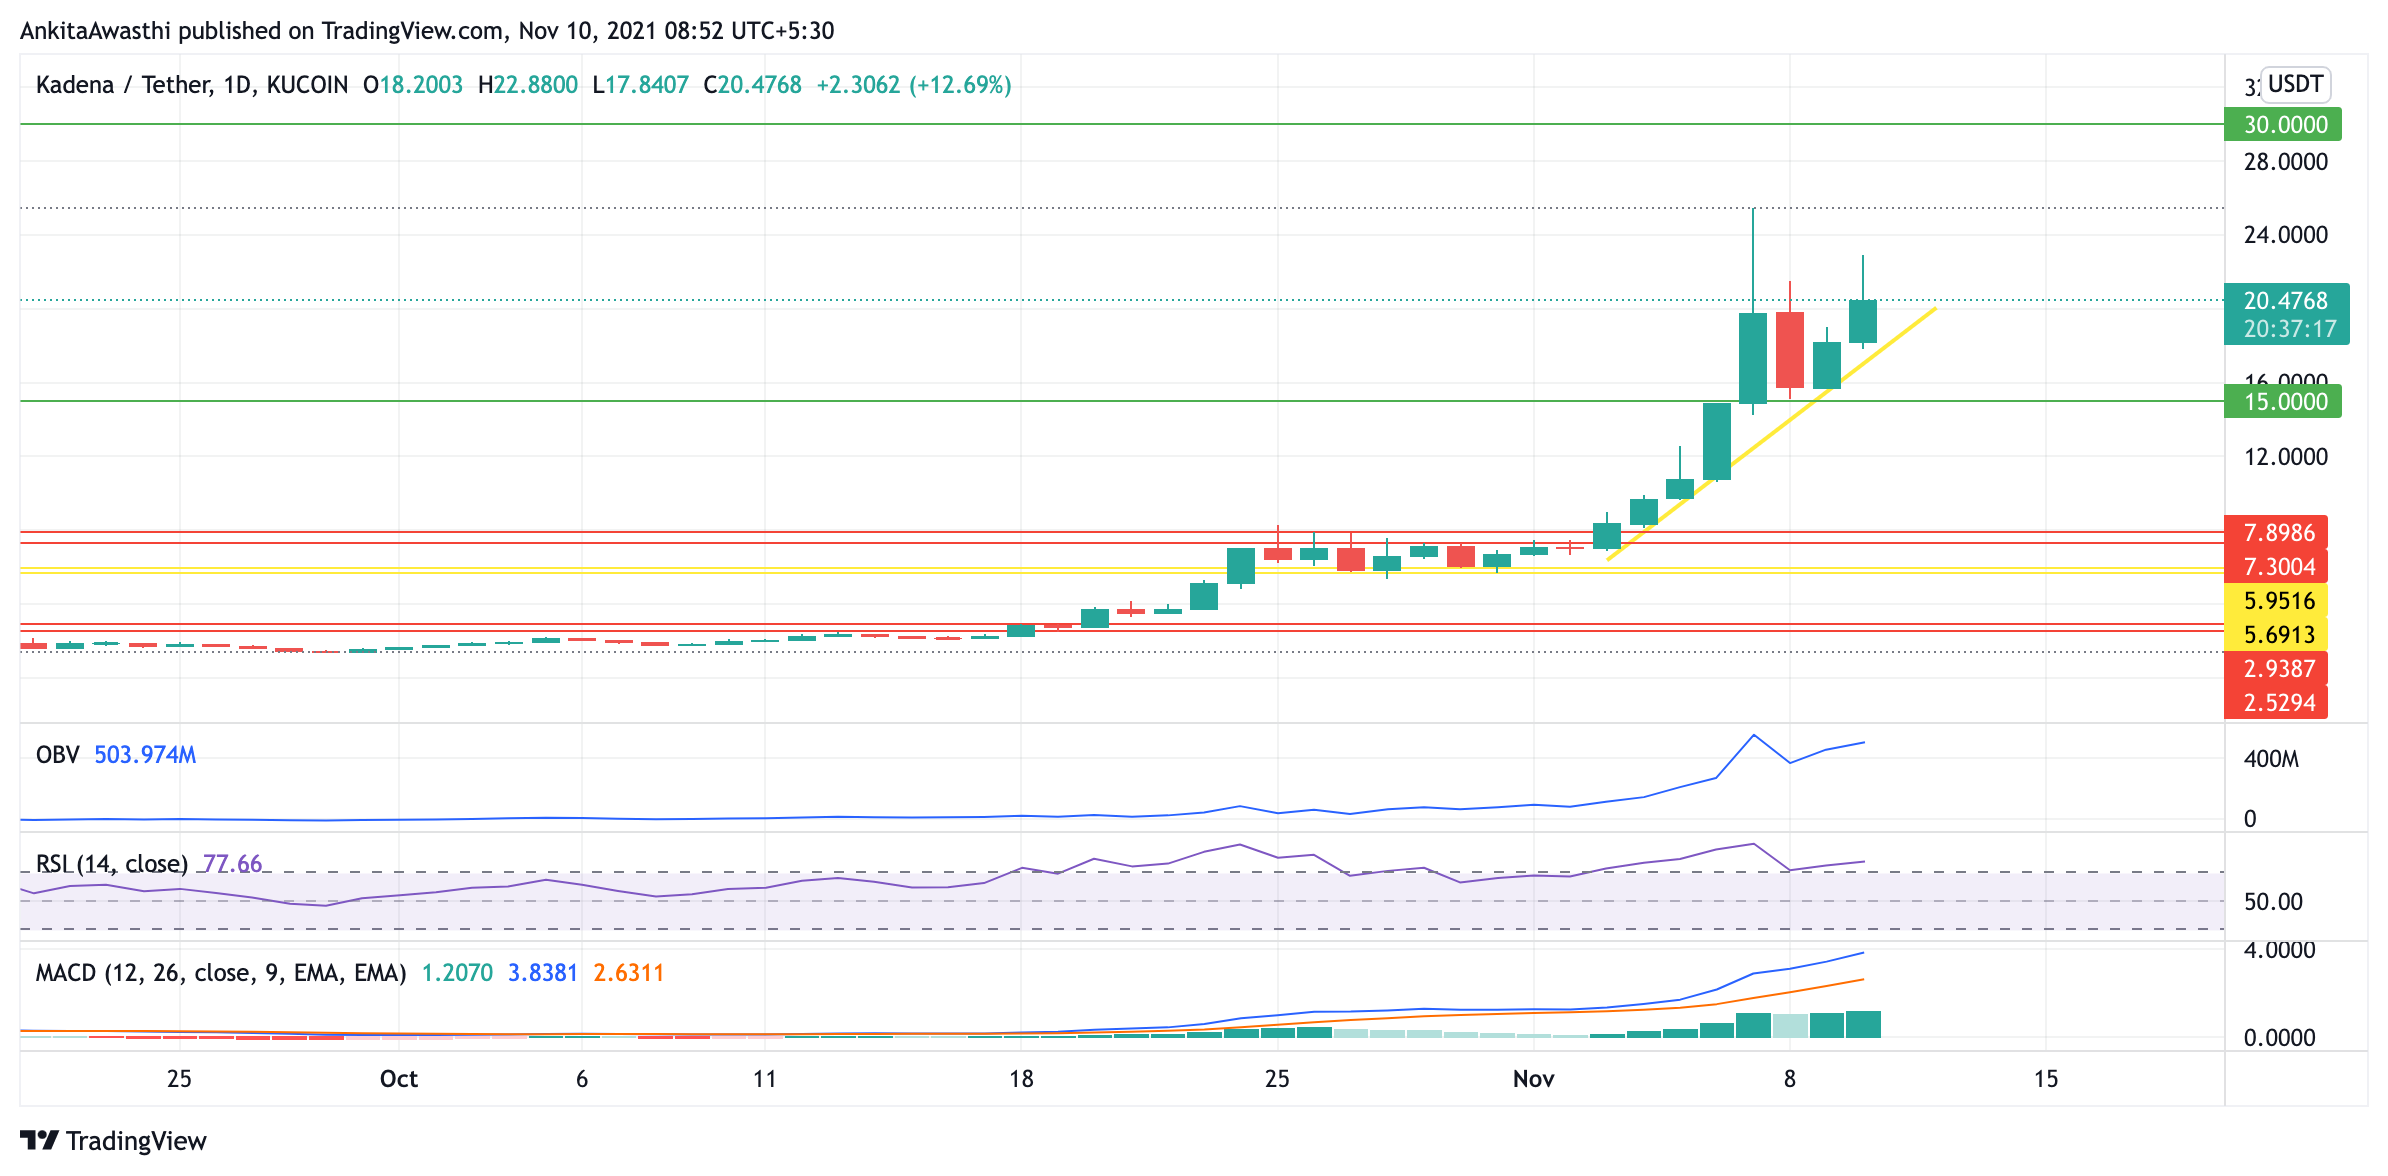
Source: https://www.tradingview.com/x/AzggMIBm/
KDA Technical Analysis
The price has managed to take help from the previous incline support and is now continuing the uptrend. The bulls are back in the power, as the market price today is 14.25% higher than yesterday’s close at $20.76.
The OBV graph is following a pattern similar to that of the price chart. The buying volume is dominating the selling volume, thus putting pressure on the price to move further up.
The RSI has rebounded upwards from the boundary at 70% from entering the normal trading zone. This is a signal for the increased strength of the bulls. Currently, at 77.73, the RSI is expected to remain in the overbought region in the coming days.
Moving average convergence divergence (MACD) is one of the most popular technical indicators in trading. The MACD is appreciated by traders the world over for its simplicity and flexibility, as it can be used either as a trend or momentum indicator.
The MACD graph is showing a parabolic chart, with the fast line and the slow line moving upwards. The height of the histogram is also increasing. This is a positive signal.
Day-Ahead and Tomorrow
The KDA price chart has crossed all the current Fibonacci pivots due to its parabolic increase.
The indicators are giving strong bullish signals. The traders can take a short position here by keeping a stop-loss at $30. However, as the price is soaring very high, traders should be alert for the bubble to burst. In this case, they can keep the stop-loss at $15.