EOS (EOS) has finally begun to show some bullish signs and could initiate an upward movement that takes it above its Sept highs.
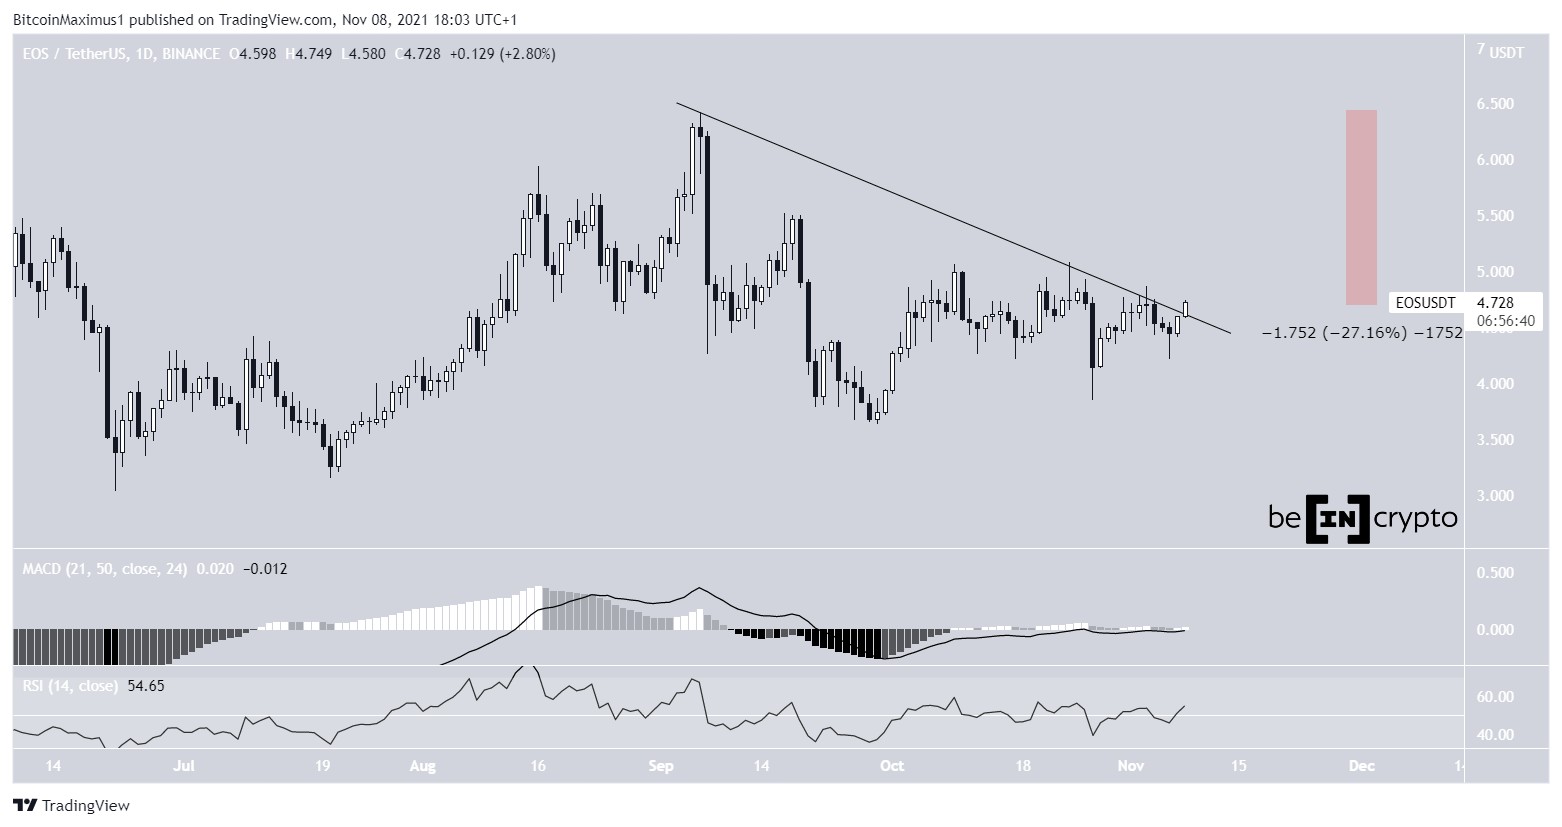
EOS has been lagging considerably compared to other altcoins. The token is still 27% below its Sept highs of $6.42. However, there are signs that the token will move upwards, both in the price action and in technical indicators.
Both the MACD and RSI are moving upwards.
The MACD, which is created by a short- and a long-term moving average (MA), is finally back in positive territory. This means that the short-term trend is faster than the long-term one.
The RSI, which is a momentum indicator, has moved above 50 once again. This is a sign of bullish momentum and is associated with upward movements.
In addition to this, EOS is in the process of breaking out from a descending resistance line that has been in place since the aforementioned highs. If successful, it would confirm that the correction is complete.
Will EOS break out?
The shorter-term six-hour chart shows that the main resistance area is at $5.06. This is the 0.5 Fib retracement resistance level and a horizontal resistance area.
There is also resistance at $5.40, created by the 0.618 Fib retracement level. However, this is not a horizontal resistance area, thus it is likely to be weaker.
Similarly to the daily time-frame, the MACD and RSI both support the continuation of the upward movement.
Once EOS manages to clear them, there is no more resistance left until the Sept highs.
Wave count
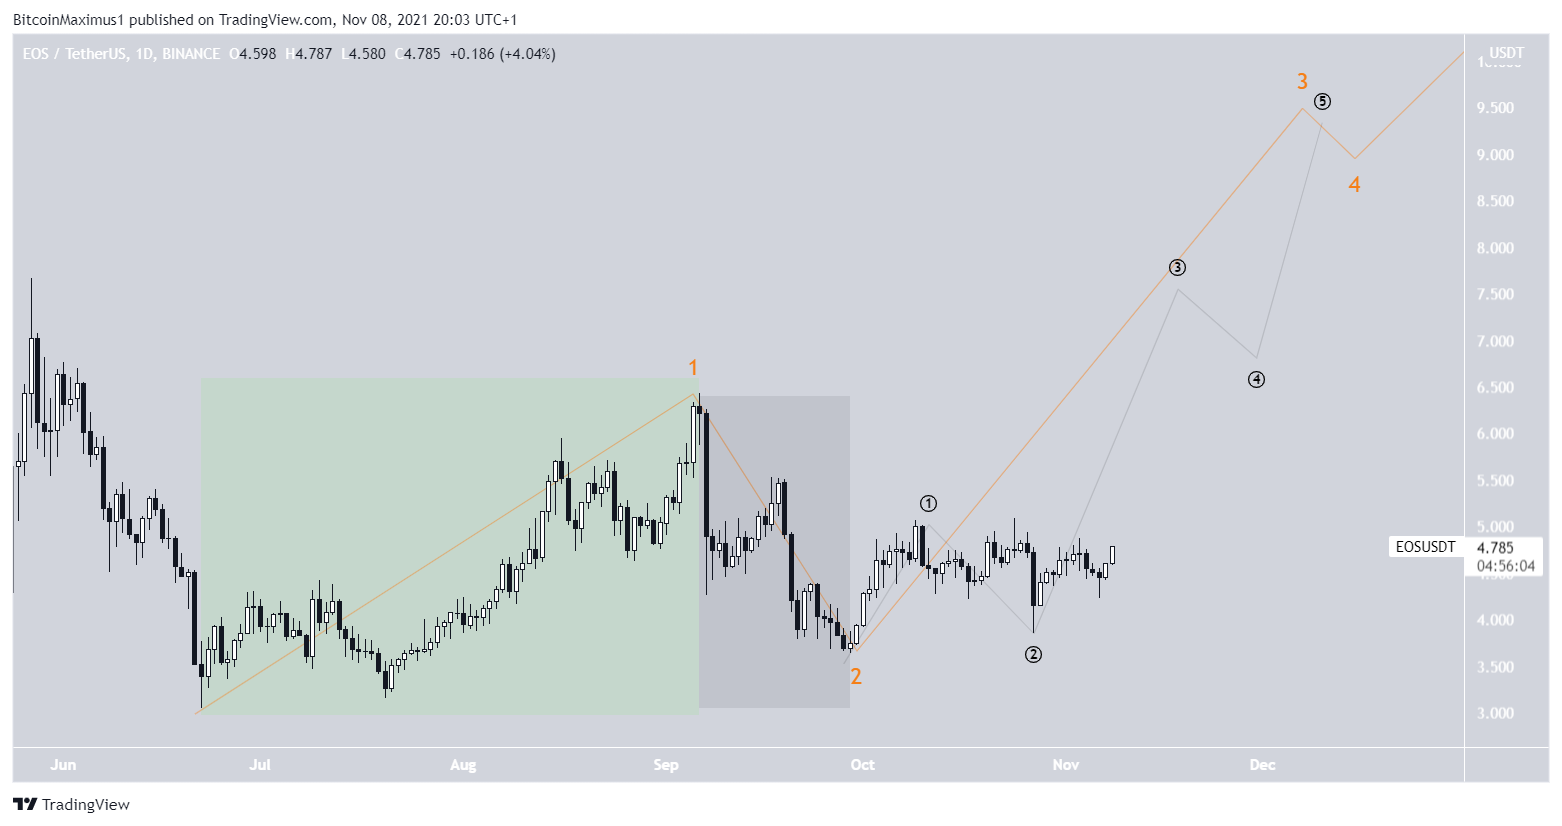
Cryptocurrency trader @Altstreetbet outlined an EOS chart, stating that the token has begun a new bullish impulse and will move towards is Sept highs at $12 and beyond.
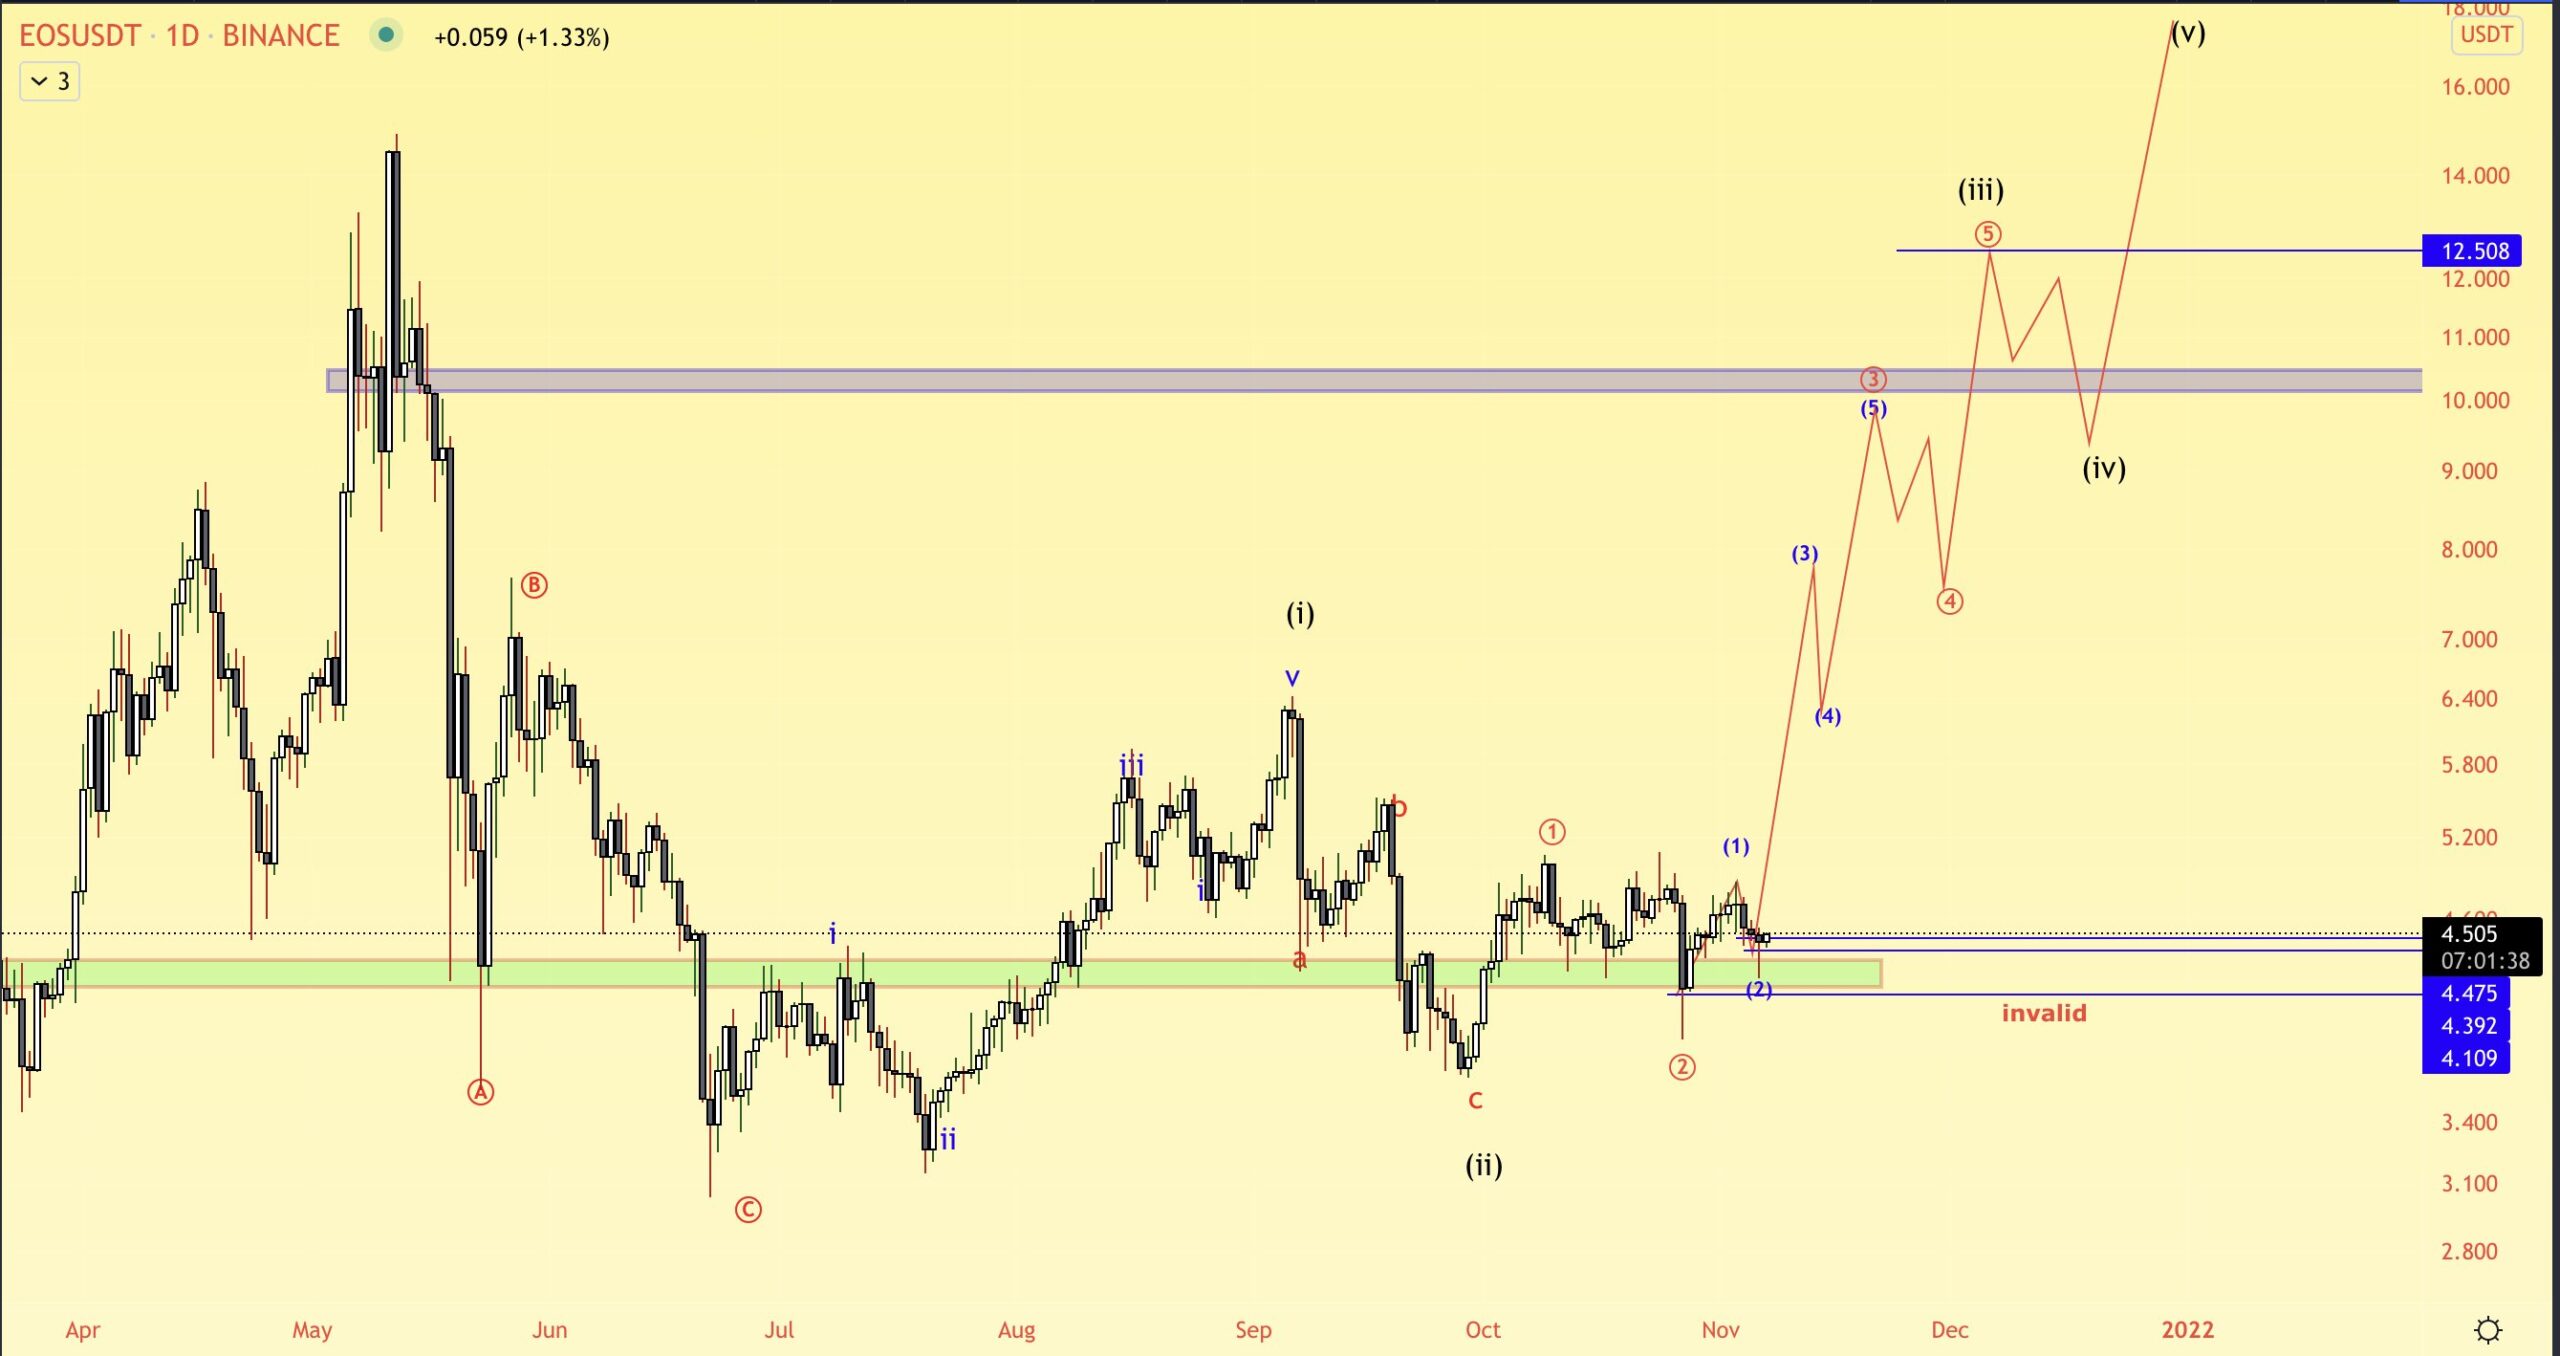
The most likely wave count does suggest that EOS has completed wave one (orange), and is now in wave three of a five wave upward movement.
The main reason for this particular count is the fact that the increase after June 22 has five waves (highlighted in green), while the resulting decrease (highlighted in black) has only three waves. This suggests that the trend is bullish, and the downward movements are corrective.
The sub-wave count is given in black.
A decrease below the sub-wave two low of $3.85 would invalidate this particular count.