- Quant price analysis is bearish today.
- The bulls are struggling to gain control.
- The bears might lose their momentum soon.
- Quant trades between $258.37 and $252.33 in the last 24 hours.
- It might be a suitable time to invest as the Quant market is gearing up to recover.
Today, Quant price analysis is more on the bearish side. However, the bulls are struggling hard to take control. Though, despite the bulls pushing the market upward, the resistance from the bears is relatively high. Hence, some indecisiveness is apparent in the Quant market today.
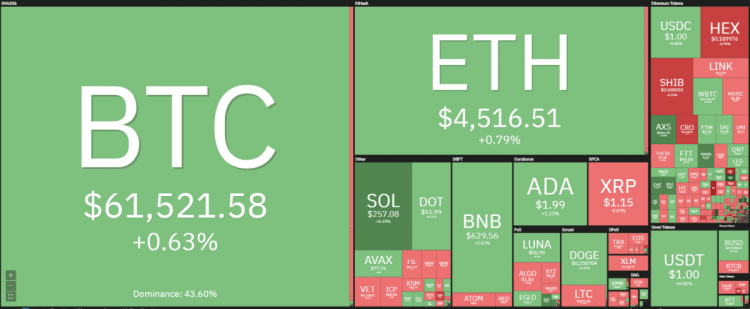
When we look at the overall market trend, most of the market is currently in the green. However, some altcoins such as Ripple are taking the downfall.
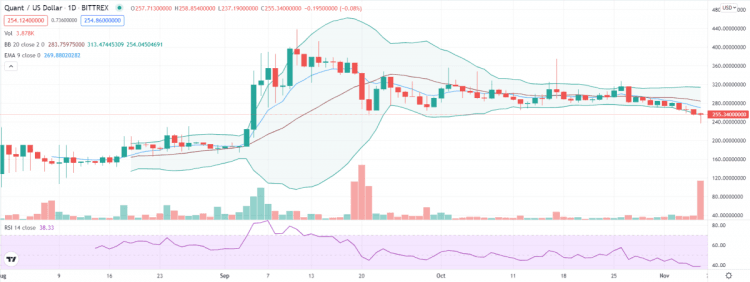
Currently, the RSI levels are lower than 40 on the 1-day Quant price analysis chart. Hence, the market is oversold, and the resistance is high. The EMA line shows a sustained downtrend, suggesting that the market is also following a downtrend over the last few days.
Quant 24-hours price movement
The Quant price analysis shows a fluctuation between $258.37 and $252.33 in the last 24 hours, with the current price at $255.34. Though, it might fall lower in the coming intervals as the RSI line is steeply decreasing after a quick rise. Again, it shows that the bears have a stronger hold on the market today.
Today, Quant has a volume to market cap ratio of 0.02438 with a 53.36% increase in the 24 hours trading volume. Based on the market cap, Quant is on the 55th spot.
Quant 4-hour price chart: The bulls continue to struggle for control
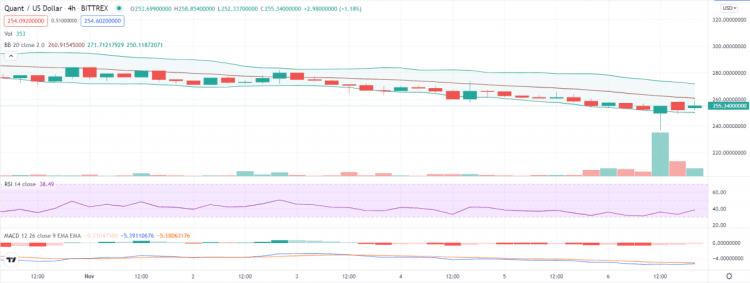
On the 4-hour Quant price analysis chart, it looks like the bulls are struggling hard to gain some control over the market. The current interval remains bullish, while for the most part, we see a bearish downtrend.
Though, the RSI line currently has a positive gradient. Though, the level is still below 40. It will require more push from the bulls to increase the RSI above 40. Beyond that, one can hope that the market can achieve some stability.
Similarly, we see that the MACD lines are nearly converging, indicating that a crossover might occur. If that happens, the next 4 hours can mark some recovery in the price. But will Quant retrace to 31st of October’s high ($284.2)? Well, that is unlikely.
Quant price analysis: Conclusion
After setting support at $237.19, Quant recovered slightly again. Though, the bulls still need to push more for stability. For now, the indication of a price increase is not that strong as the market is predominantly bearish. It could also be a suitable time for short-term investment as the bulls seem to be gearing up.
While you wait to see Quant recover again, how about you read our extensive guides on crypto investing?