- The DOT bulls discovered a new ATH yesterday.
- Polkadot price analysis is in favor of bears today.
- Support is still standing at $51.6.
The Polkadot price analysis shows the coin is correcting today as it has retraced back to $52.6. Overall, DOT/USD is bullish as it continues to discover new heights every day, but today’s price function is on the bearish side. Yesterday’s price function was also bearish for the first half of the session, but the bulls regained control and took Polkadot to a new record high. Today again the price is sliding down till now.
DOT/USD 1-day price chart: Profit booking hinders further upside
The 1-day price chart for Polkadot price analysis shows a decrease in price has been observed today. The price, after capping at a record high of $54 yesterday, has reduced to $52.6 today, as the coin is trading at the later value at the time of writing. The trading volume has gone down by 15.6 percent today, as the DOT/USD also reports a loss in value by 1.72 percent over the last 24 hours, but the crypto pair reports a massive gain in value by 21.29 percent over the past week. However, the market cap has suffered by 1.17 percent over the last 24 hours.
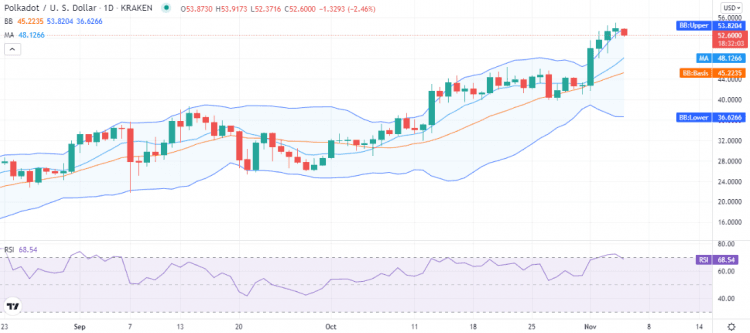
The relative strength index (RSI) has taken a downturn and has reverted back into the neutral zone after remaining in the oversold zone for some time. The RSI is trading at index 68, still near the overbought zone but on a downward curve, indicating an increase in selling activity in the market.
The volatility is high for Polkadot as the Bollinger bands are still diverging at a good pace, with both limits of the indicators diverging almost equally. The price has stepped down below the top limit of the indicator, which was representing support for the DOT, but has now turned into resistance for the coin, and the support has come down to the level of the mean average of the indicator, which is present at $45.22.
Polkadot price analysis: Recent developments and further technical indications
The 4-hour Polkadot price analysis shows that the price breakout was downwards from the start of today’s session, and the price has been falling since then, but the fall rate has been slowed down recently.
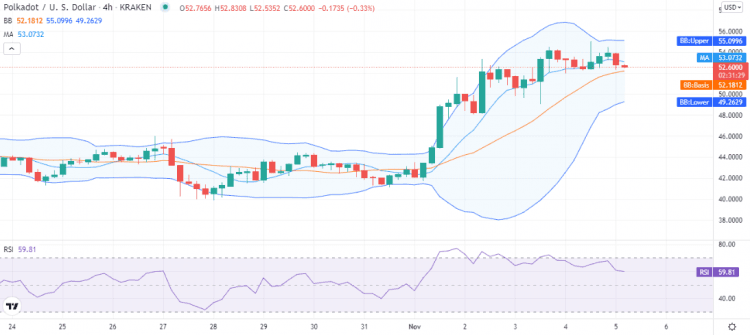
The RSI, after coming down on a sharp curve for the starting four hours, now shows a little horizontal movement, which indicates the sellers’ dominance in the market, but the intensity has decreased, which might support the DOT price for the coming hours. The price has stepped below the moving average on the 4-hour chart, indicating a bearish crossover. The volatility is mild as the Bollinger bands, after converging steeply till yesterday, have now taken the shape of a not-so-district channel with the mean average at $52.18 representing support for the falling price.
Polkadot price analysis conclusion
The Polkadot price analysis suggests that the coin is retracing after observing a record high again yesterday. The overall bullish Polkadot is correcting at this time which is a very natural phenomenon for more upwards movement. Despite the correction, we believe the Polkadot will maintain above $50 today. Even a reversal in trend is also possible and we might observe a new record high.
Disclaimer. The information provided is not trading advice. Cryptopolitan.com holds no liability for any investments made based on the information provided on this page. We strongly recommend independent research and/or consultation with a qualified professional before making any investment decisions.