- The price has reached an all-time high.
- Avalanche price analysis is bullish.
- Support is present at $76.3.
The Avalanche price analysis shows that the currency is presently at an all-time high of $79, continuing the bullish movement. The AVAX/USD price capped at $75.5 yesterday, just a dollar short of the previous all-time high of $76.5, but today’s bulls took the price higher still to a new high.
Price analysis shows that the price may fall slightly to test support at $76.3 but will have a hard time going lower.
There’s an ascending channel in play right now, and the price is making higher highs and higher lows. As seen from the 1-day chart below, there’s resistance present at $82 and support at $76.7.
The RSI is above 50, which may indicate a bullish bias towards the currency going forward. The MACD indicator shows no divergence from the price – a sign that a bullish run will continue in the future.
AVAX/USD price movements in the last 24 hours: Bulls on a march to score a record high
The 1-day price chart for Avalanche price analysis reveals that bulls continue to push the bar higher, as they already are at $79.2, the value at which the crypto pair is trading at the time of writing. Today is the fifth day in a row of nonstop bullish momentum, and during this time, the currency has increased in value by over 115%.
In the future, the bulls are likely to move towards the $82 resistance level. At first, they’ll either create a new first high there or will fail to do so and then pull back down. The 1-day chart for AVAX/USD shows that the price is now at support at $76.7, which will present a strong barrier for the bulls.
The channel in play right now can be considered to be ascending, as it runs upwards. The price has been making higher lows and highs, which suggests that this bullish momentum isn’t going anywhere soon. If the Bulls maintain their good performance, they’ll likely take the price to $82 first.
AVAX/USD 4-hour chart: Bulls look like continuing their bullish run
The 4-hour AVAX/USD Chart clearly shows two things – first, that the bulls are still on the offensive, and second, some bearish divergence might appear after a bit of time. First off, AVA continues to show positive momentum, as the price is now at $80.8, which suggests that there’s resistance just above this level at $82.
The RSI shows no bearish bias in play right now – indicating the possibility of a bullish continuation. However, buyers have been unable to push prices across the 61% Fibonacci retracement level in a convincing manner, which means that a bit of bearish divergence might be in the cards.
The bulls have been able to breach the descending trendline on two occasions now but haven’t held prices above it for long. If they manage to keep up their good work and keep moving forward, they’ll likely take the price to $82 first, a critical resistance level that will present a significant barrier for buyers.
AVAX/USD daily chart: Bears are in danger of losing their position
The AVAX/USD Daily Chart shows us two things – first, bulls are on the offensive, and second, bears might lose their position if they can’t keep up. Bulls are still holding their ground, as the price is now at $80.8.
The descending trendline is still in play, and the bulls will likely take prices above where it currently stands at $81 or below where it lies at around $78 to score a first high.
The RSI on this chart shows no bearish bias, hinting at the fact that there’s still room for bulls to gain more ground. However, if bears can’t hold back the bullish momentum soon enough and manage to lure prices towards the $77 support level, they might lose their grip over AVAX/USD market.
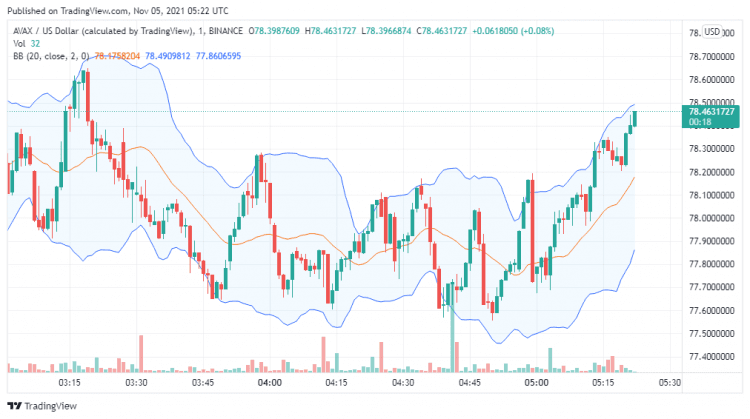
The RSI on the 4-hour chart though in the overbought region, has flattened out, indicating the tiredness of bulls after a high and continuous rally. The RSI may take a turn back in the coming hours, calling a sell-off. The volatility is relatively high on the 4-hour chart, with the upper Bollinger band indicating support for AVAX at $78.5.
AvalanchePrice Analysis: Conclusion
The Avalanche price analysis shows the price is at an all-time high level of $79.2 after swinging as high as $81.2. But the RSI indicates a slow down in bullish progress, and a short-term pullback is also possible if selling pressure kicks in. Traders can expect a new record high today if the bullish momentum continues and the price gets capped above $76.5.
Disclaimer. The information provided is not trading advice. Cryptopolitan.com holds no liability for any investments made based on the information provided on this page. We strongly recommend independent research and/or consultation with a qualified professional before making any investment decisions.