- Solana price analysis is bullish today.
- SOL bulls are trying to set a record high today.
- The only resistance next is the ATH of $210.
- Strong support is found at $200.
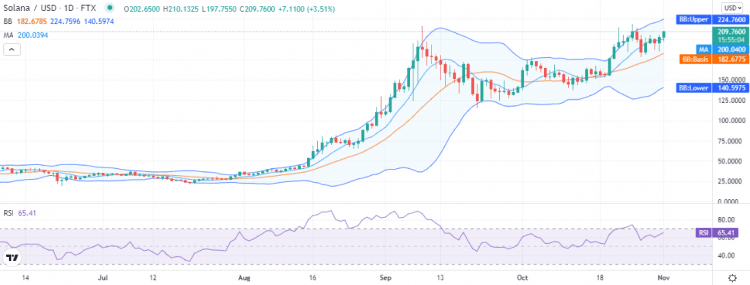
The Solana price analysis reveals the coin is on a bullish ride today as it nears the ATH of 25th October at the $210 mark. Bulls are on the march towards their target and will soon over cross the ATH, but the success depends on if they can keep the momentum going and get the price capped above the present ATH, for which there exist ample chances.
SOL/USD is on an upwards trend from 20th October, and after hitting the ATH on 25th October, retracement followed for two days, and again from 28th October, the SOL started upside again. This is the time for SOL/USD to mark a higher high.
SOL/USD 1-day price chart: Bulls to hit a new record high?
The 1-day price chart for Solana price analysis shows that the price is near the previous ATH, and there is no resistance except the previous ATH itself. Bulls will take the SOL price towards a new record high in a matter of minutes as the Solana is trading at $209 at the time of writing. SOL bulls have helped the cryptocurrency in gaining 10 percent value over the last 24 hours, but only 0.52 percent over the past week, as the former ATH was also achieved during this time, followed by a correction.
The trading volume though not on the higher side but has significantly increased by 94 percent over the last 24 hours, which indicates keen interest from market shareholders as the price is nearing the ATH again.

The volatility for Solana is high, but the volatility indicator shows an upwards breakout, with the upper band at the $224 mark representing resistance for SOL and the lower band at the $140 mark. The average of the indicator is forming at $182, which represents support for SOL/USD. The upwards breakout of the indicator suggests the price to trade on the higher side for the coming days.
The relative strength index (RSI) is also on an upward trend as it is trading at index 65 near the overbought zone, indicating a higher buying ratio in the market. However, the RSI is still in the neutral zone. As the SOL price moved above the moving average (MA), the MA now trades at $200 below the price level complementing the bullish trend.
Solana price analysis: Recent developments and further technical indications
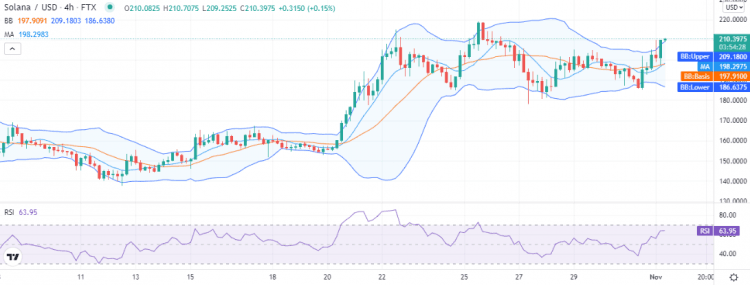
The 4-hour Solana price analysis shows the bears tried to hinder the bullish momentum as the price kept moving downwards for the first four hours today. During the next four hours, the bulls reversed the price function in their own favor and took it steeply up; the bullish progression still continues at the time of writing with the price oscillating above and below the $210 mark.

The 4-hour chart also shows that the volatility has been increasing today, as the Bollinger bands now show the following reading; the upper band is at $209, just below the price level acting as support for the crypto pair and the lower band is at $186, the mean average of the indicator is at $197, representing support for SOL/USD. The RSI shows a turn in the horizontal direction, hinting at a slow down in the buying activity, even a balanced situation between the buying and selling in the market.
Solana price analysis: Conclusion
The Solana price analysis suggests that SOL bulls are almost at ATH level right now, but as said above, the success depends on their ability to cap the price above the ATH; otherwise, it will be just an hourly upswing, chances are there for both the scenarios to take shape. If the buyers’ support persists for a few hours, then a new record high is confirmed. But as the RSI on the 4-hour chart is hinting, chances exist for a reversal as well if selling overwhelms the market in fear of a short-term downside or maybe profit booking by the traders.
Disclaimer. The information provided is not trading advice. Cryptopolitan.com holds no liability for any investments made based on the information provided on this page. We strongly recommend independent research and/or consultation with a qualified professional before making any investment decisions.
 cryptopolitan.com