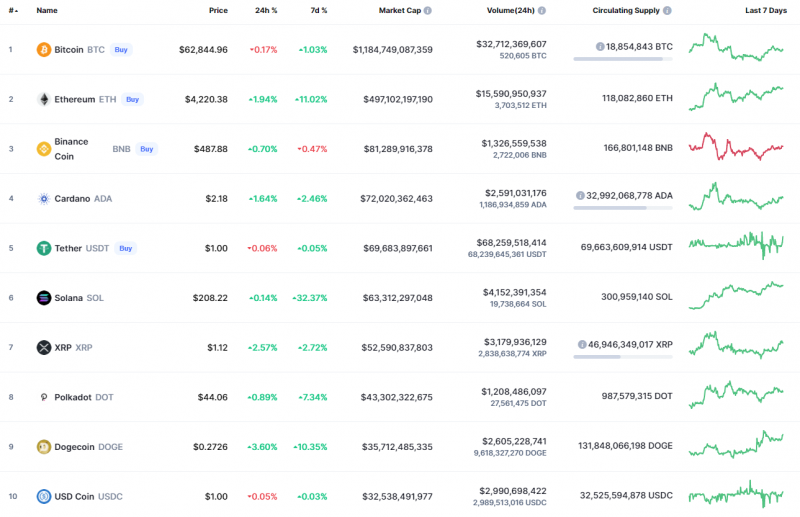
The majority of the coins remain in the green zone except for Bitcoin (BTC), whose rate has declined by 0.17% over the past 24 hours.
SHIB/USD
SHIB keeps setting new peaks, rocketing by 17.38% since yesterday.
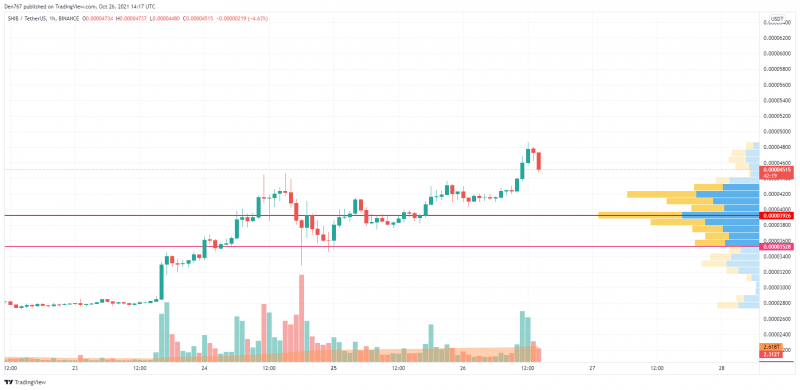
On the hourly chart, SHIB made a false breakout of the 4,800 satoshi mark supported by the increasing trading volume.
In terms of the nearest price action, the decline may continue to the liquidity zone at 4,000 satoshis, where bulls may again seize the initiative.
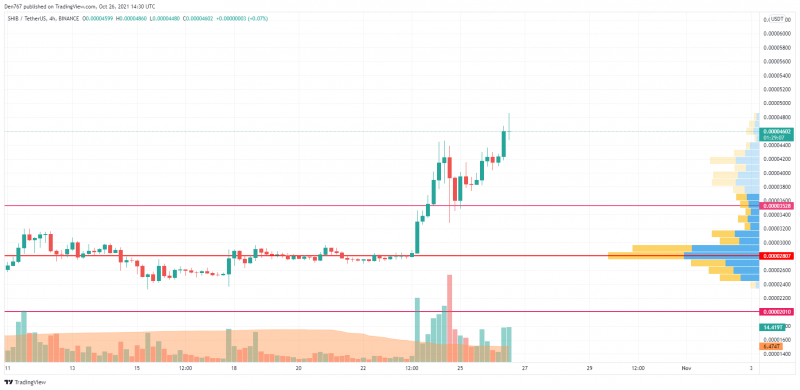
On the 4H chart, the drop may continue as buyers have no power to keep the rise going. In this case, the correction may last until SHIB makes a retest of the support at 3,528 satoshis. Such a scenario is valid until the end of the current week.
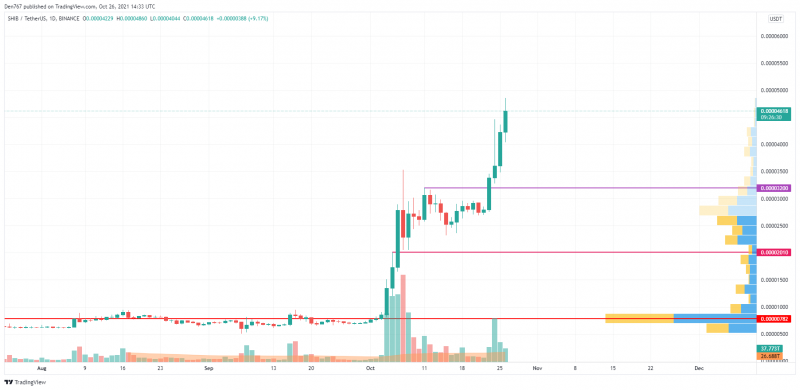
SHIB has been rising for the last five days, which confirms the current bullish trend. However, SHIB is overbought to a certain extent, which means that bulls can face a short-term correction to get more energy for continued growth.
The fall may bring SHIB to the nearest support at 3,200 satoshis shortly.
SHIB is trading at 4,625 satoshis at press time.