Zilliqa is a public, permissionless blockchain that is designed to offer high throughput with the ability to complete thousands of transactions per second. It seeks to solve the issue of blockchain scalability and speed by employing sharding as a second-layer scaling solution. Zilliqa was first conceived by Prateek Saxena, an assistant professor at the National University of Singapore School of Computing. Let us look at the technical analysis of ZIL.
Past Performance
ZIL opened on 16 October 2021 at $0.096. The previous week witnessed a valley. It closed on 22 October 2021 at $0.11. This was an overall change of 14.5% over the week.
Source: https://www.tradingview.com/x/HT37IdYh/
ZIL Technical Analysis
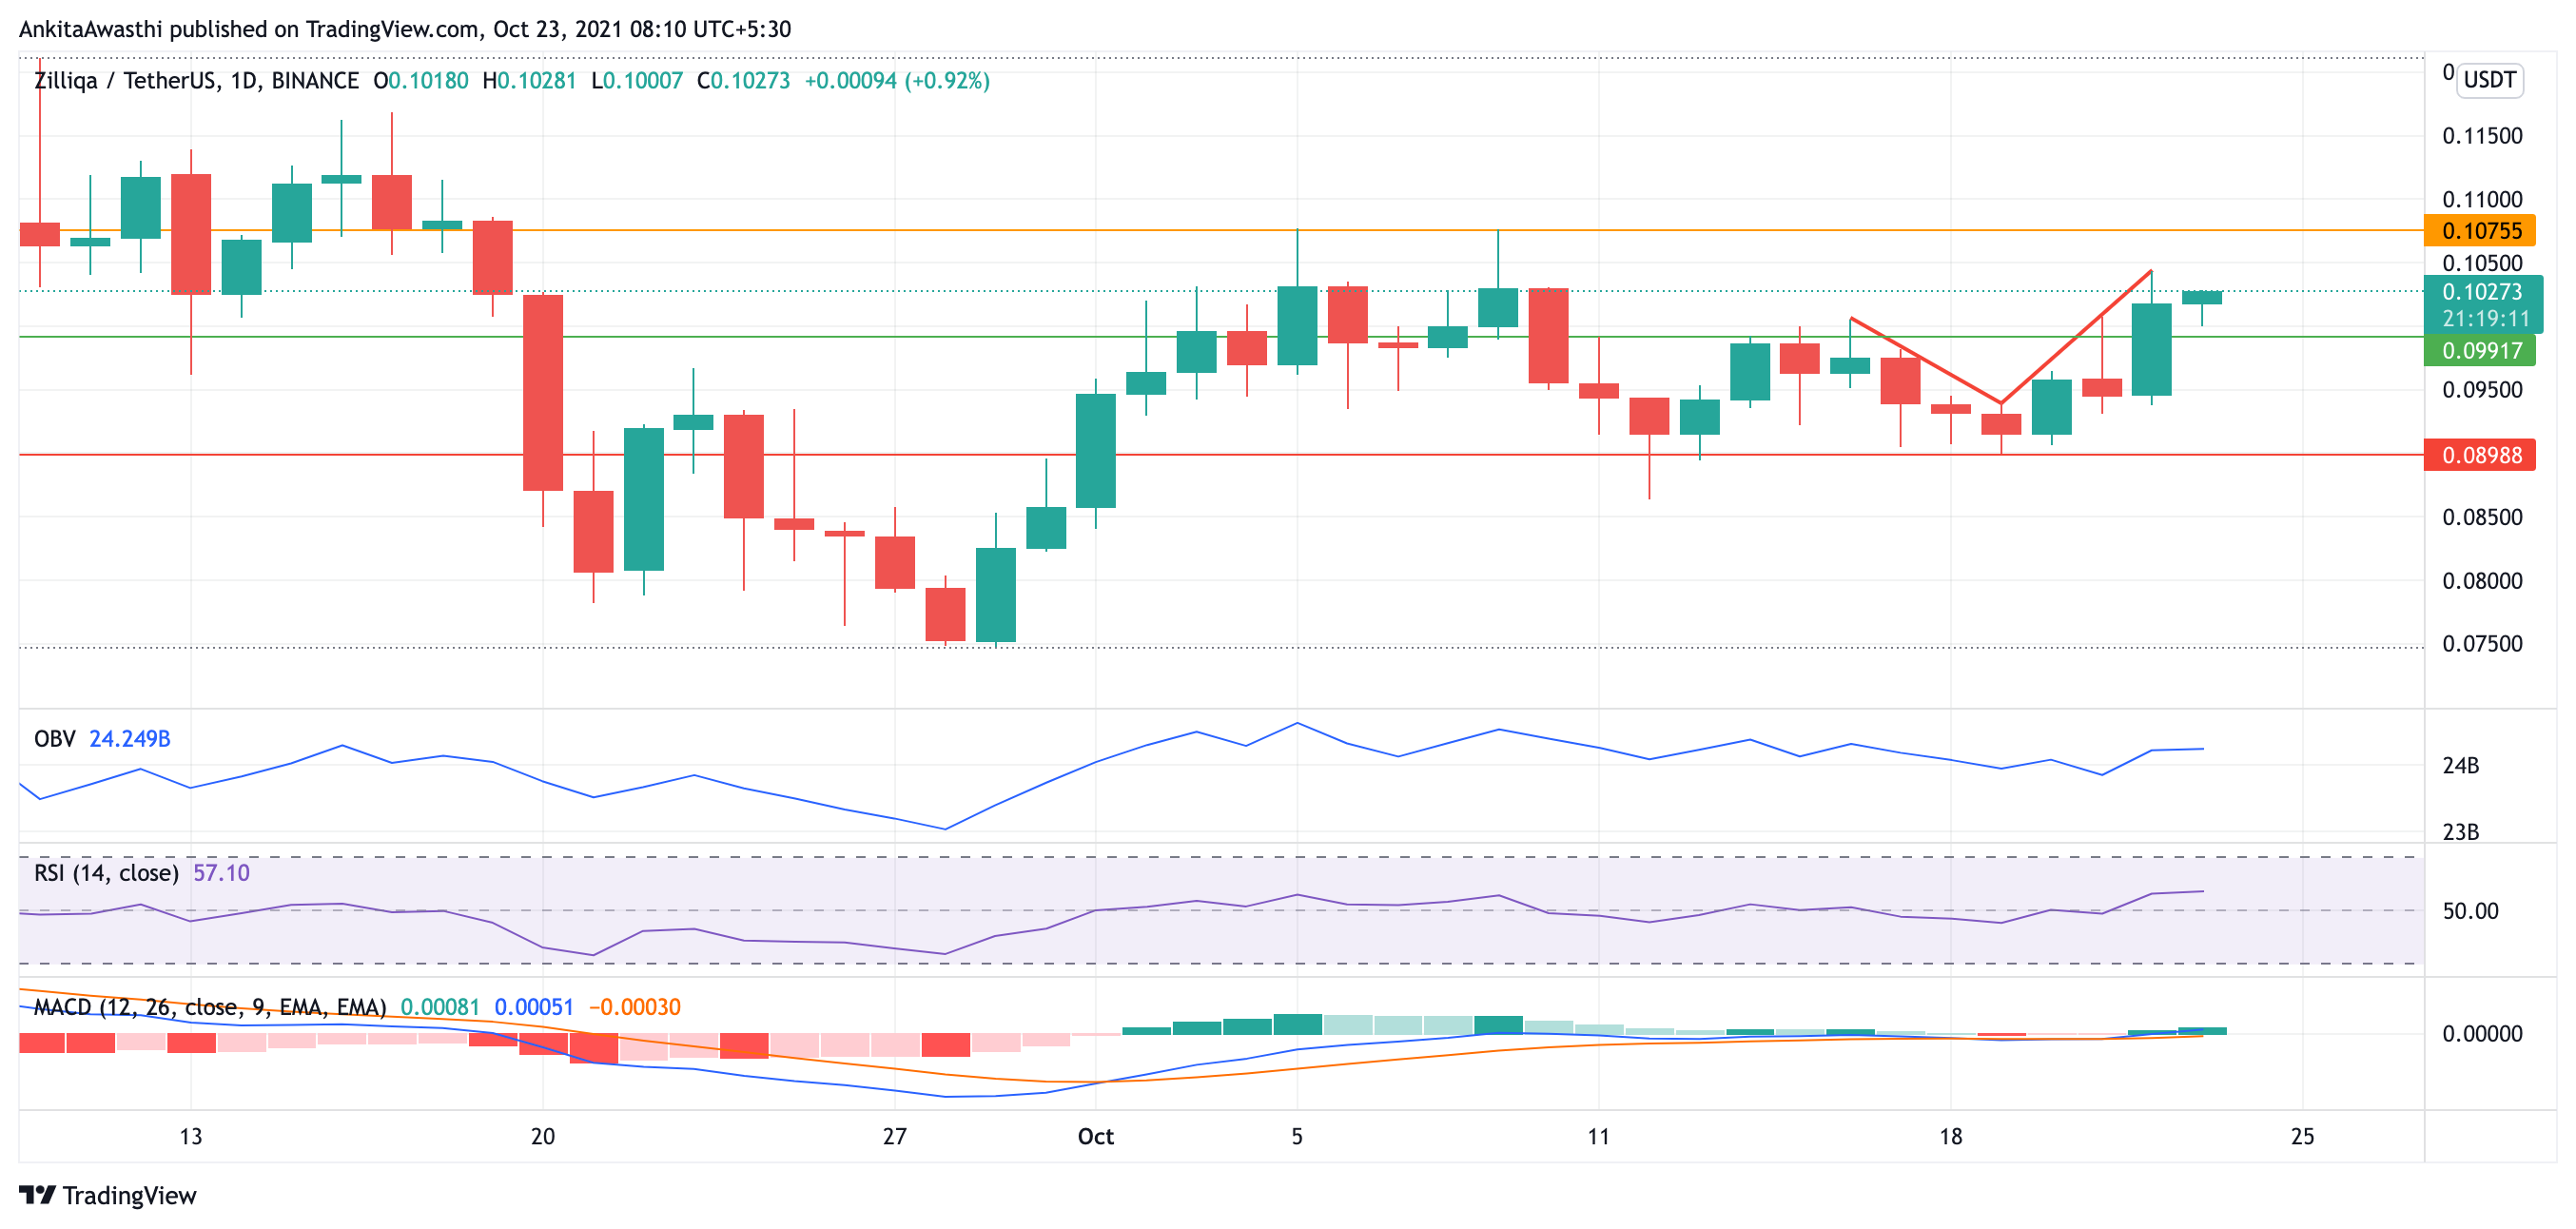
The week started for ZIL with a decline in the prices. The trend took support at $0.089 to reverse itself. Right now, an uptrend can be seen in the price chart. The current trading price of ZIL is 0.103, which is about 1.02% higher than yesterday.
OBV is showing a horizontal line in its graph. This means that the buying and selling pressures are balancing each other. This is a neutral signal, meaning that the traders may hold their current positions.
RSI is on an uptrend. Currently, at 57.17%, it is giving a positive signal. The traders may take a long position here.
MACD is showing that the fast line is taking over the slow line. This is a strong buying point. Thus, the traders may take a long position based on this.
Day-Ahead and Tomorrow
Fib numbers show that the base of the valley was the Fibonacci pivot of $0.09. The next Fibonacci target is at $0.11.
Thus, the indicators are signaling that the traders may take a long position here. Target can be kept at $0.107 and stop-loss can be placed at $0.099. However, OBV is showing a neutral signal, which means that the trend may reverse itself.