AAVE coin price is under an inverted flag pattern. However, the recent rise in the ascending triangle proposes a breakout shortly.
Aave, a decentralized finance protocol, allows people to borrow and lend crypto.
By depositing digital assets in specially-created liquidity pools, lenders earn interest. This liquidity allows borrowers to use their crypto as collateral for a loan.
This project lets people borrow and lend in approximately 20 cryptocurrencies. Users have more options. Flash loans, one of Aave’s most popular products, is billed as the first non-collateralized loan option within the Defi space.
Let us now take a deep look into the technical analysis of AAVE cryptocurrency.
Past Performance of AAVE
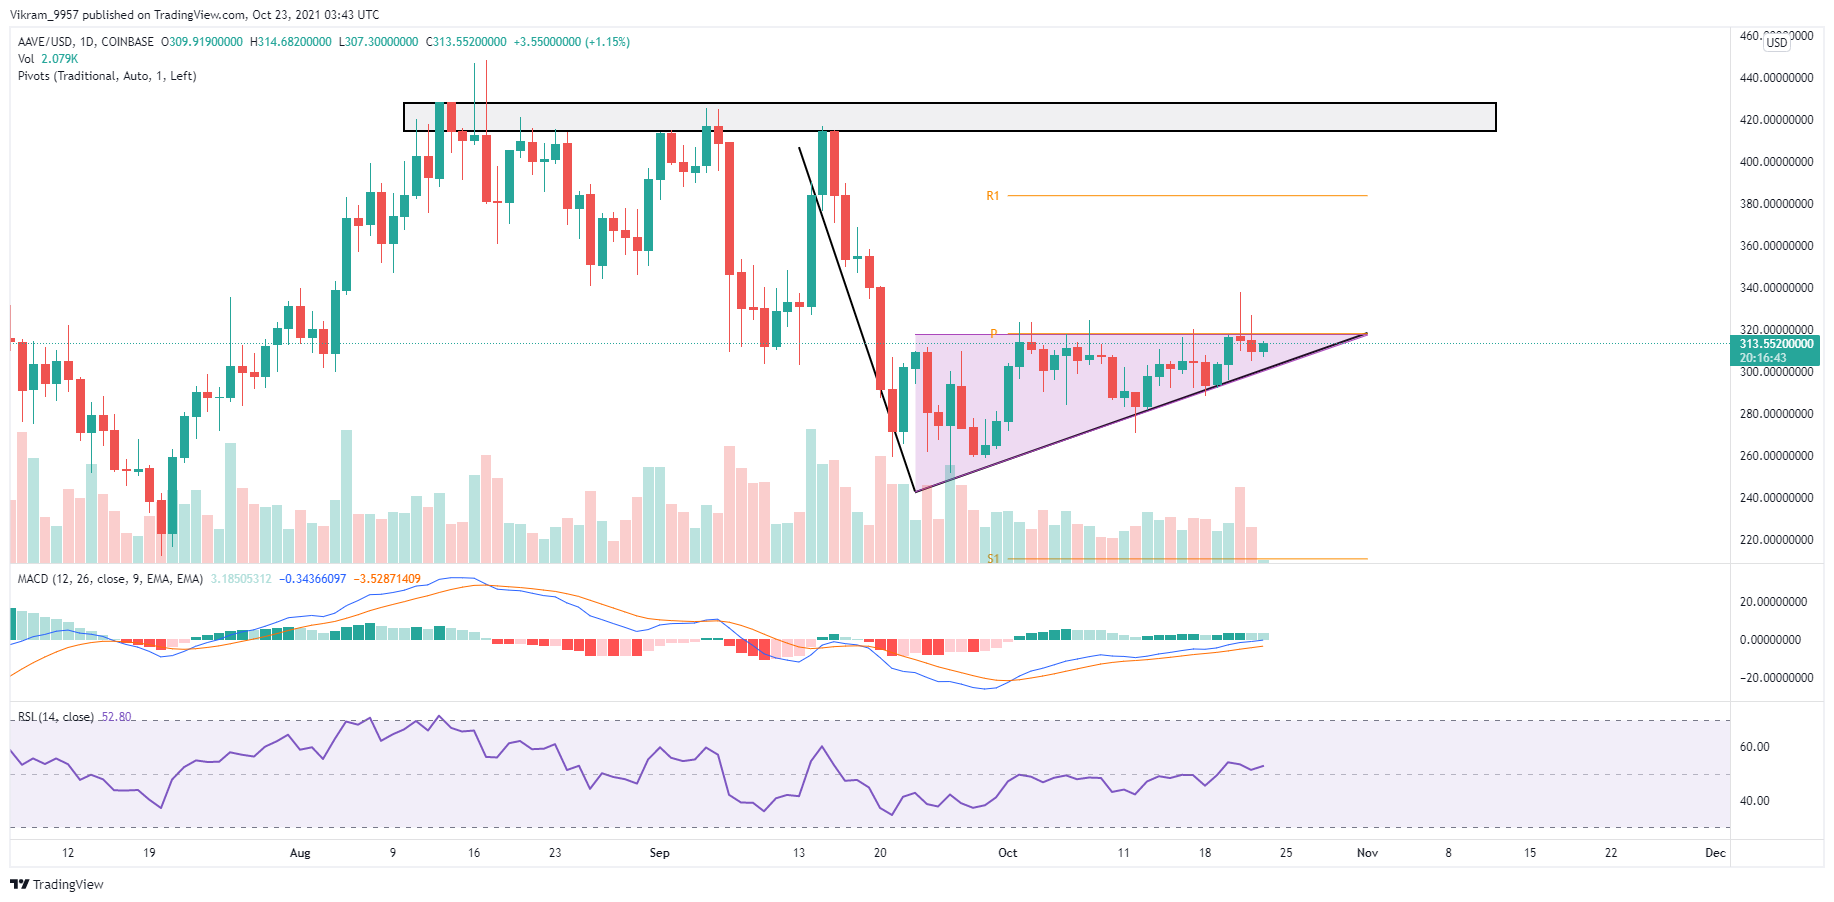
AAVE Token price failed to rise above the resistance of $415 despite numerous bullish attempts. Thus, leading to a bearish takeover, causing a downfall to the $260 mark.
However, the rise from the lower levels has led to an ascending triangle pattern. The $320 mark coincides with the pivot level in the daily chart and acts as the flat bottom of the triangle.
The pattern holds a considerable momentum entrapped within the triangle. Thus, a breakout of either side will be decisive in the upcoming trend.
Source - Tradingview
AAVE Technical Analysis
AAVE cryptocurrency is currently at $313.49. Additionally, the cryptocurrency has decreased by 2.19% in the last 24 hours. Thus, projecting the short-term retracement within the pattern. However, the price movement lacks intraday trading volume support.
According to the Pivot Points in the daily chart, the following levels can play a crucial role. The $385 and $500 levels can, in case, act as an obstacle during the bull run. On the downside, the levels near $250 and $210 can pose as support levels.
The MACD line and the signal line in the daily chart climb towards the central zero mark. Nonetheless, the lines maintain a positive bullish alignment due to the last bullish crossover. Hence, the MACD indicator gives a bullish signal for AAVE crypto.
The RSI indicator shows a rise in underlying bullishness despite the mute price action. It is due to the climbing of the RSI slope above the halfway mark. Thus, indicating a slightly bullish signal.
Upcoming Trend
The conglomeration of the technical indicators and the price action of AAVE cryptocurrency indicates a possible bullish breakout is due. However, the inverted flag pattern warns us not to take underlying bearishness for granted.
Hence, we must wait patiently for the bullish breakout and not give in to the fear of missing out.