BeInCrypto takes a look at the seven altcoins that increased the most over the past seven days, from Oct 16 to 22.
These altcoins are:
- OKB (OKB) : 72.32%
- Nexo (NEXO) : 45.28%
- THORChain (RUNE) : 36.00%
- Zcash (ZEC) : 34.84%
- Huobi Token (HT) : 30.81%
- The Graph (GRT) : 29.66%
- Solana (SOL) : 27.37%
OKB
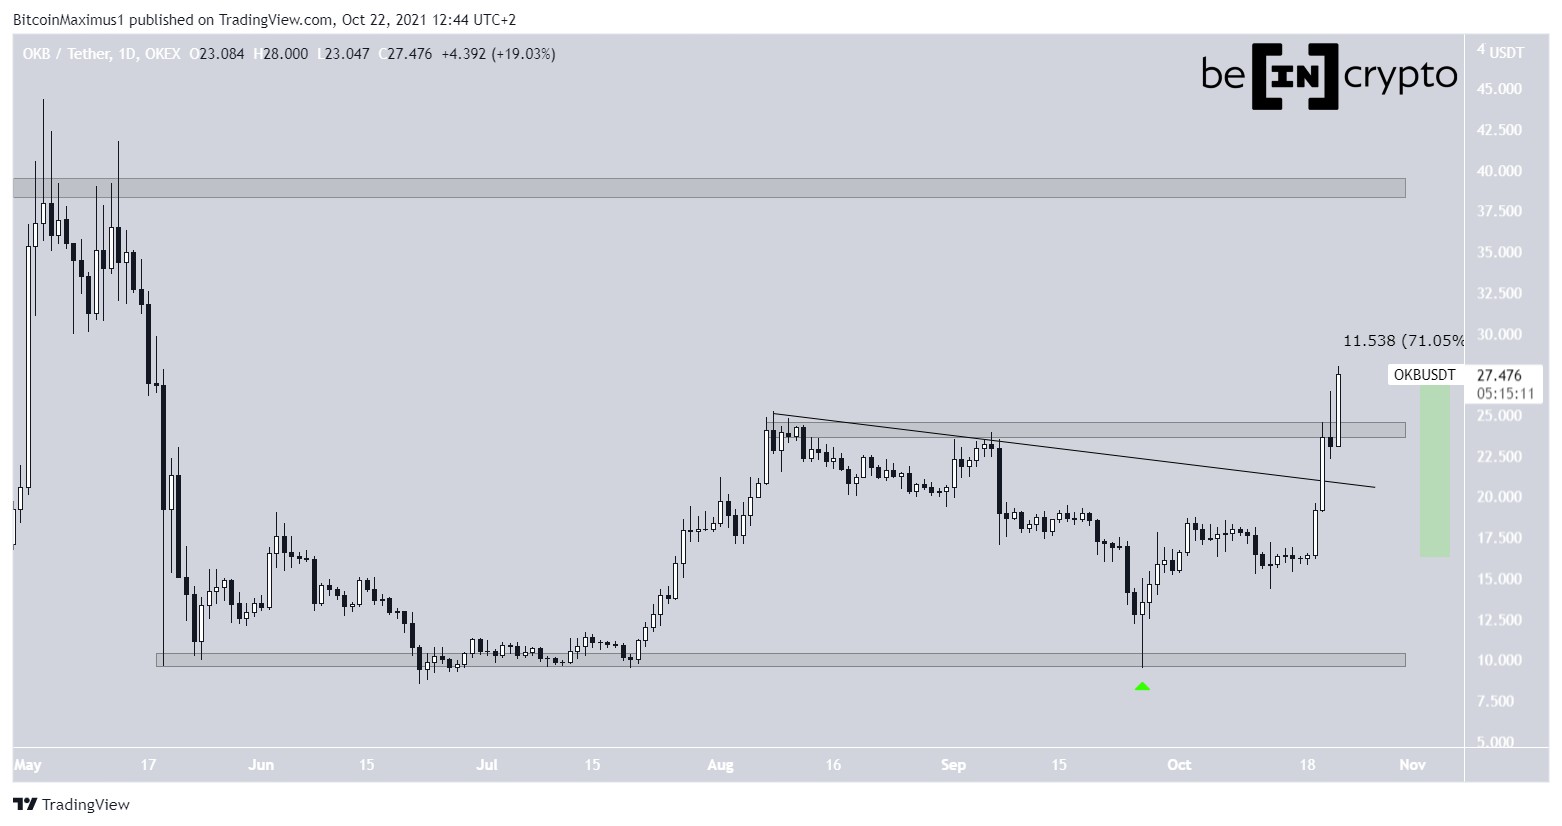
On Oct 26, the OKB price rebounded and created a very long lower wick (green icon) in the process. This was a sign of strong buying pressure, due to the length of the wick.
The increase accelerated on Oct 19 and OKB broke out from a descending resistance line the next day. This confirmed that the previous downward move had come to an end. After this, OKB moved above the $24 area, which was the resistance level reached during the September highs.
Since Oct 19, OKB has increased by 71%.
The next closest resistance area is found at $39.
NEXO
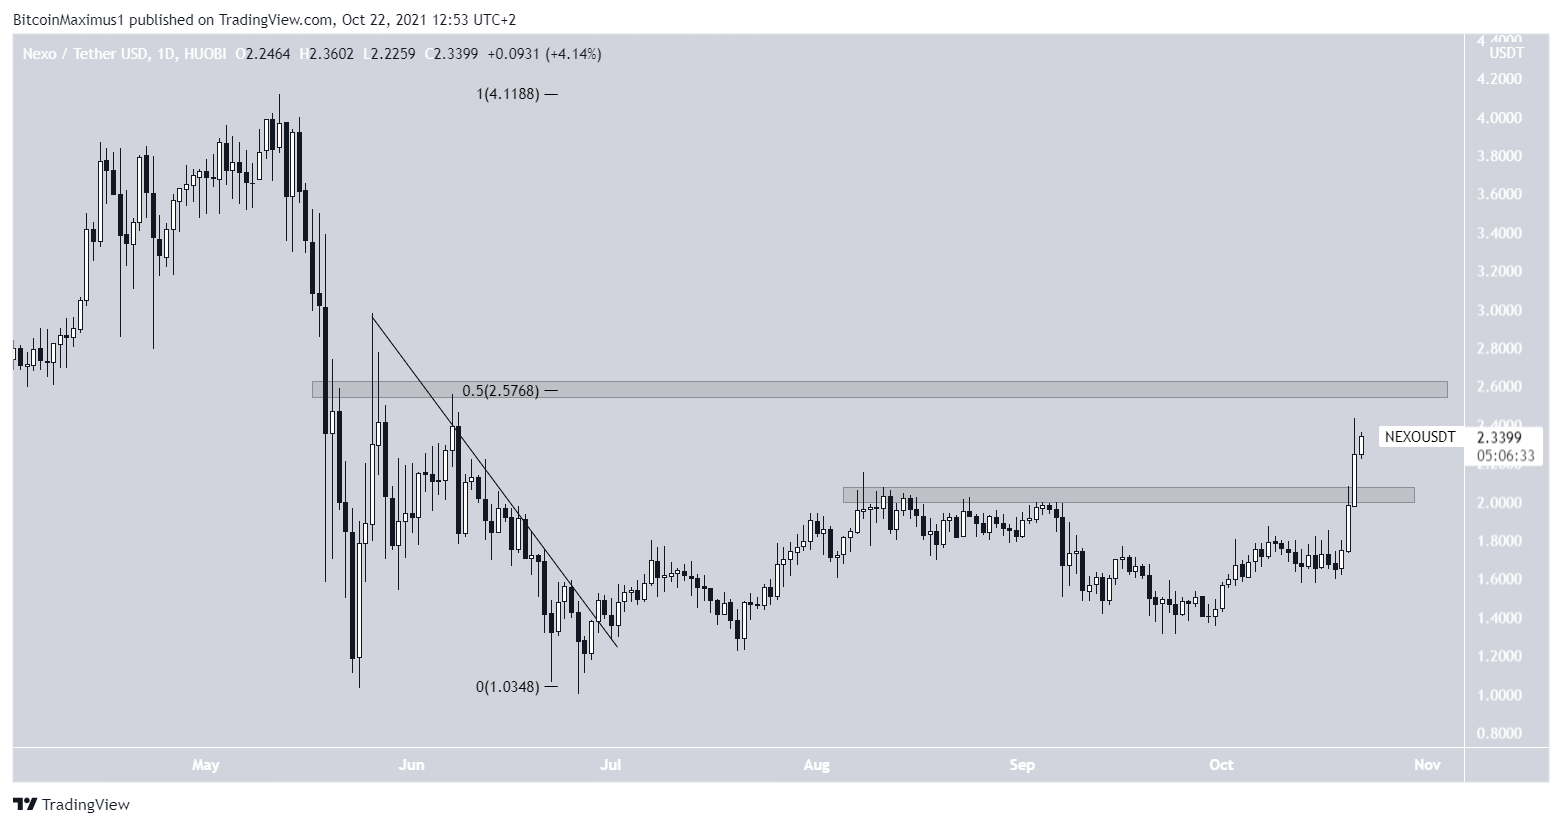
NEXO has been increasing since it made a higher low on Sept 22. On Oct 19, it managed to break out above the $2 resistance area.
This was important since the area had been in place since August. The breakout indicated that the previous correction was complete.
The next closest resistance area is found at $2.58. It’s both a horizontal resistance area and the 0.5 Fib retracement resistance level. If NEXO manages to move above it, there are virtually no more resistances until the $4 region.
RUNE
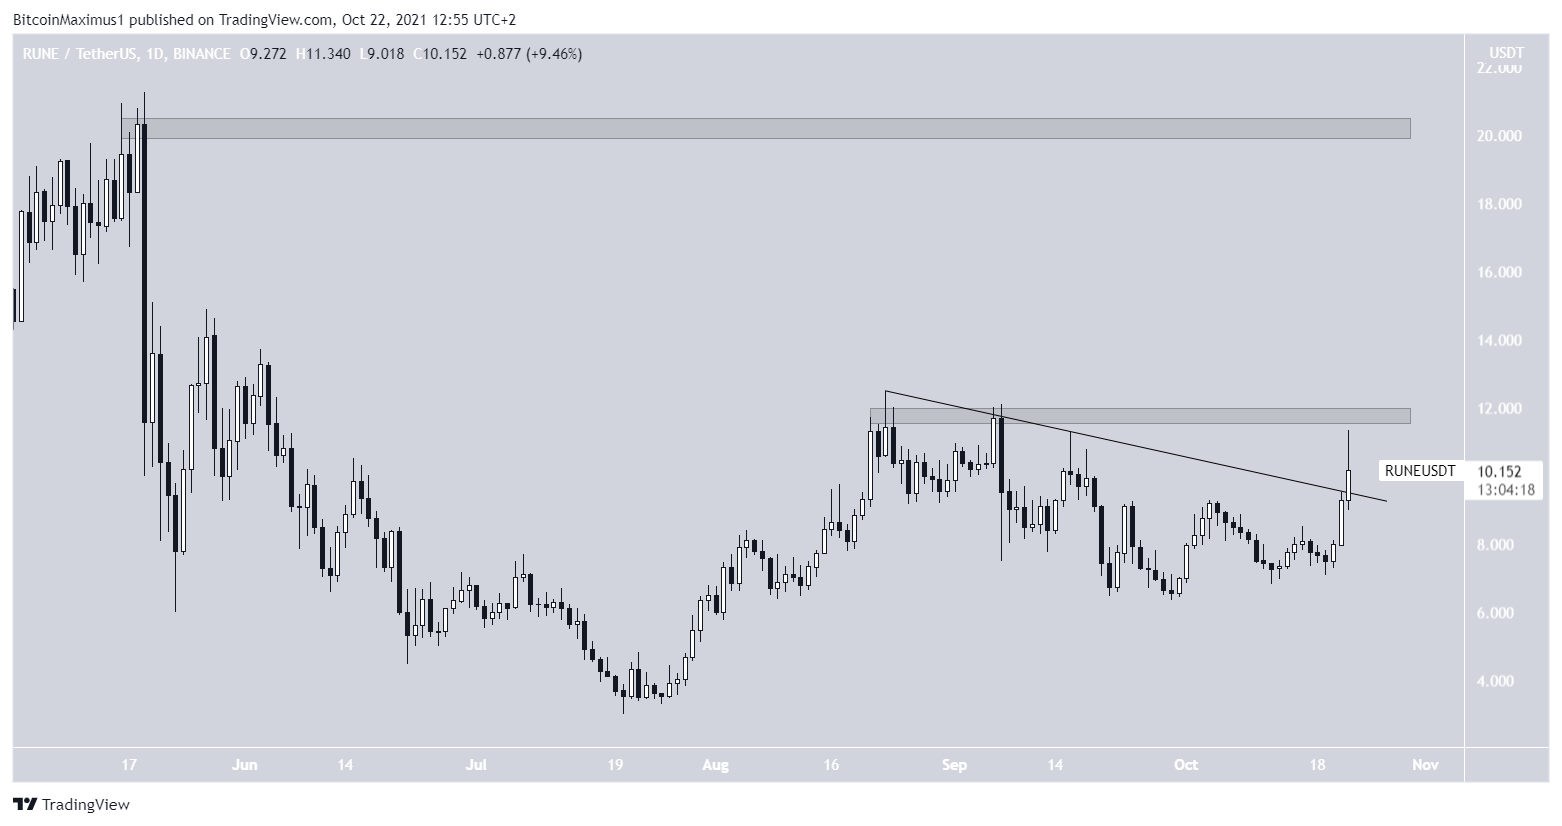
Similar to OKB, RUNE just broke out above a descending resistance line. However, unlike OKB, it has yet to move above the $11.75 resistance area, which is created by the August highs.
While the breakout from the resistance line indicated that the correction is complete, the increase is expected to accelerate once RUNE moves above the $11.75 area.
In this case, the next resistance would be found at $20.
ZEC
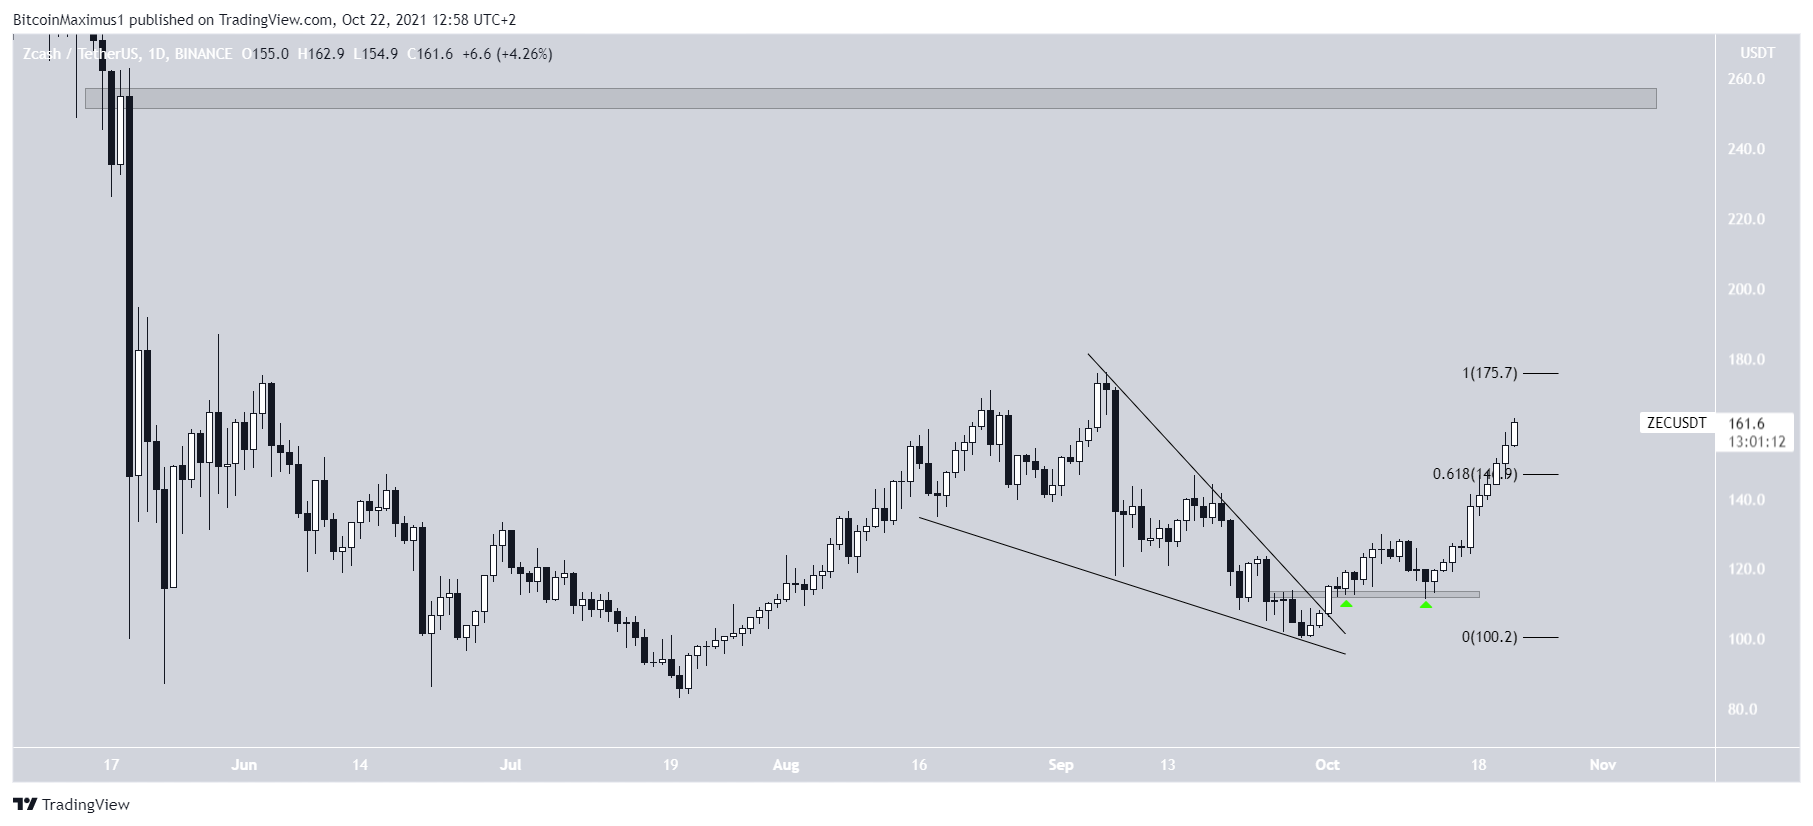
ZEC has been moving upwards since breaking out from a descending wedge on Oct 1. The descending wedge is normally considered a bullish pattern, thus a breakout was expected. After this, it bounced at the $113 area (green icon) and began to accelerate.
More importantly, ZEC moved above the 0.618 Fib retracement resistance level on Oct 20. This was crucial since the 0.618 Fib resistance level often acts as a top during bounces. Reclaiming this level suggests that ZEC is beginning a new upward rally.
ZEC is expected to accelerate once ZEC manages to break out above this resistance.
HT
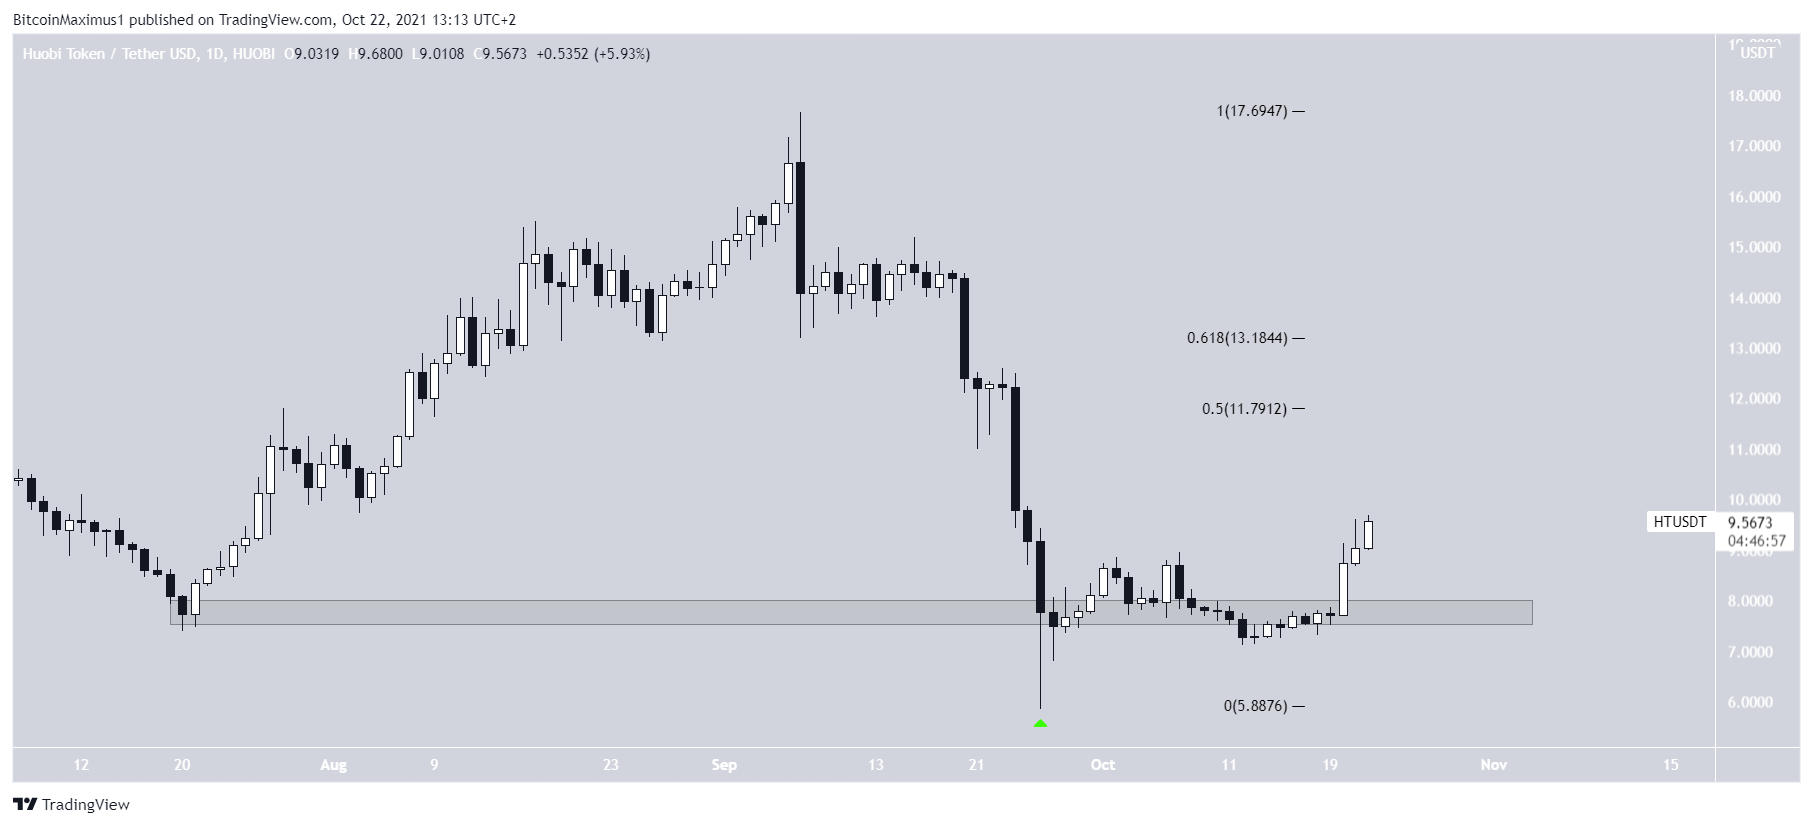
HT has been increasing since Sept 5 after it bounced and created a long lower wick (green icon). The rebound caused it to reclaim the $7.80 horizontal area.
While this is a bullish development, there are numerous resistances left to clear, beginning with the $11.75-$13.15 area, created by horizontal and Fib levels.
Until HT manages to clear these levels, the trend cannot be considered bullish.
GRT
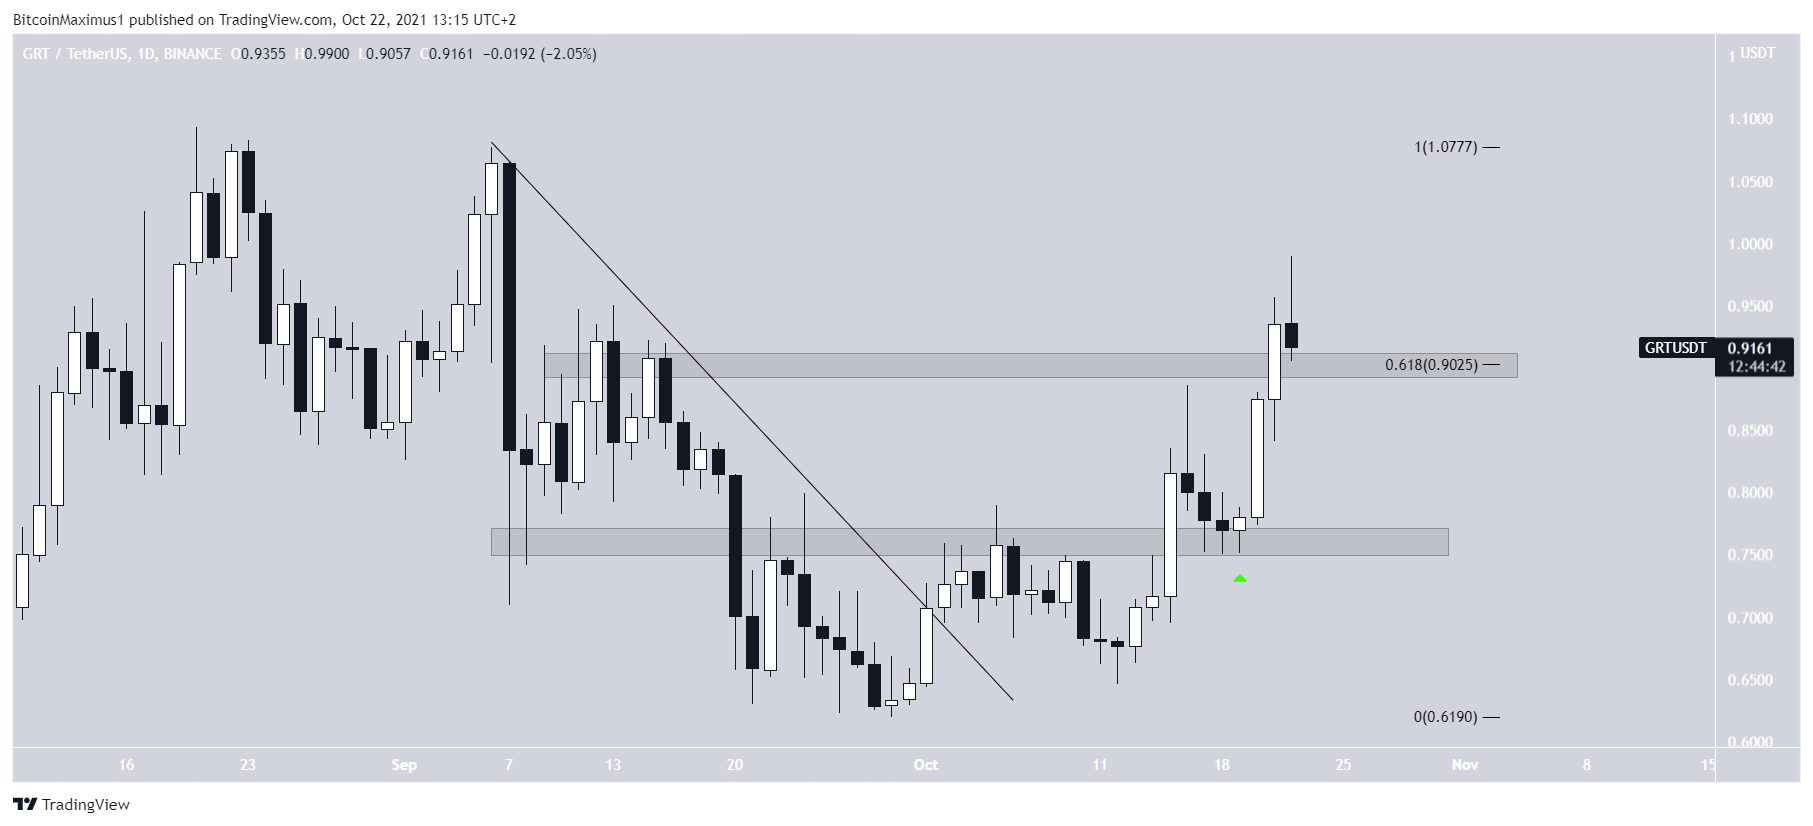
GRT has been increasing since breaking out from a descending resistance line on Oct 1. This was a sign that the downward move had come to an end.
After this, GRT reclaimed the $0.76 area and validated it as support.
Currently, it’s in the process of doing the same with the $0.90 area. This could allow it to move back towards the September highs near $1.05.
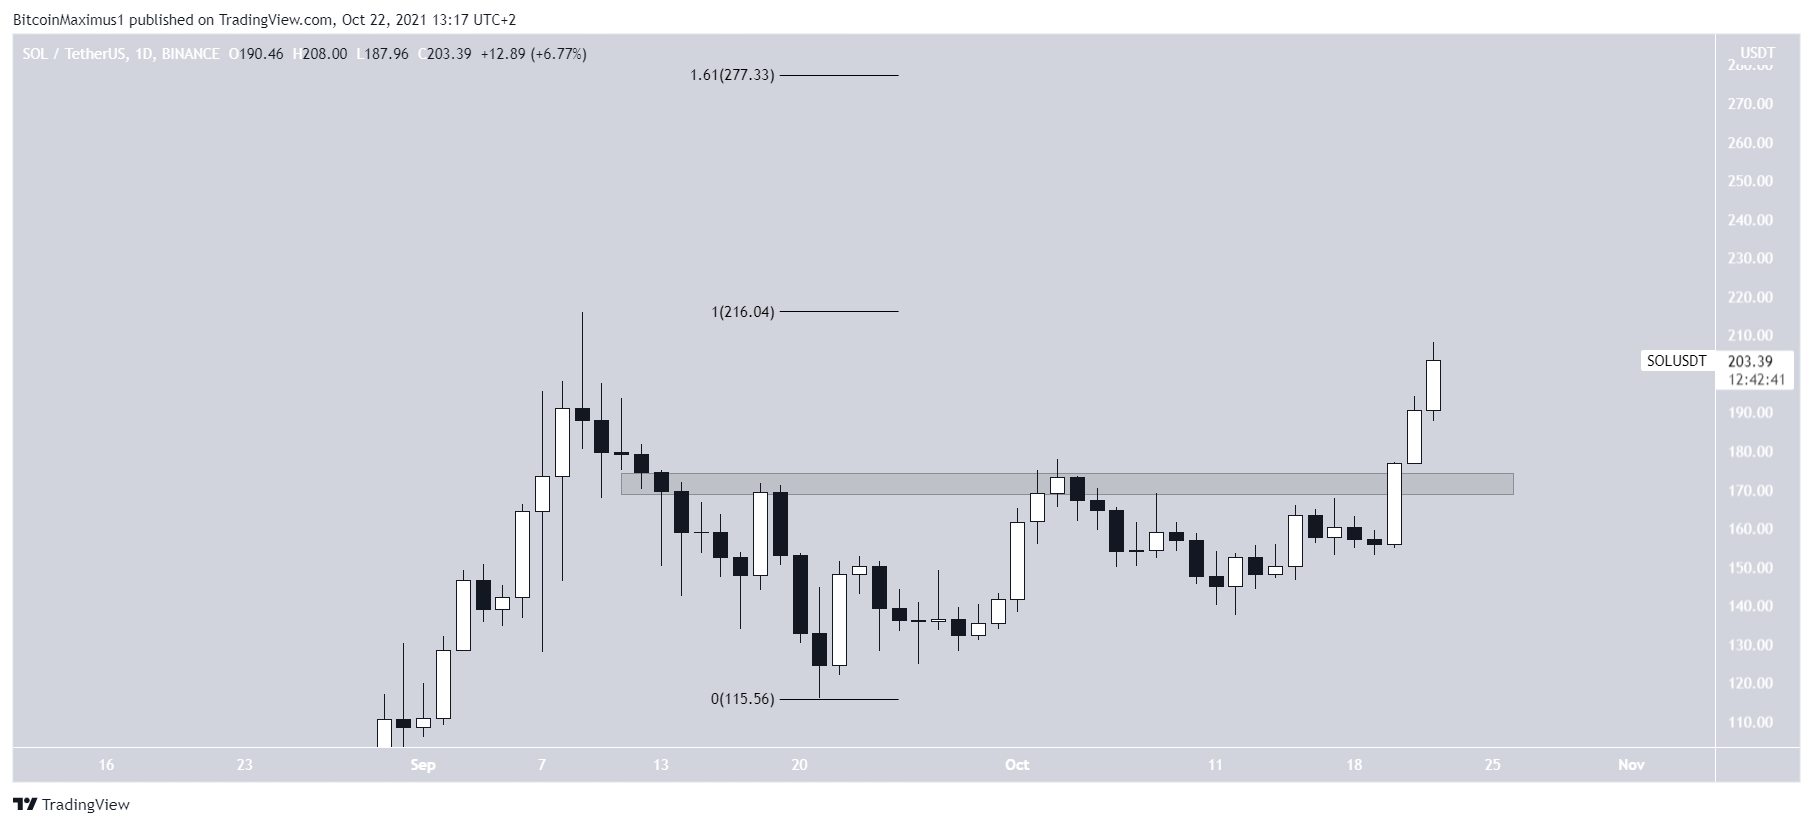
SOL
SOL has been increasing since Sept 21. On Oct 3, the upward move came to a temporary halt after SOL was rejected by the $170 resistance area.
However, SOL managed to break out on Oct 19 and has been increasing at an accelerated rate since.
If it reaches a new all-time high, which looks likely, the next resistance could be found at $277. This is the 1.61 external Fib retracement resistance level. This Fib level is commonly used to find the higher resistances when prices are at all-time highs.