OKB coin price experiences a colossal surge in underlying bullishness that may soon double the growth within the few upcoming weeks.
OKB is the OKEx utility coin that allows users to access special features of the crypto exchange. For example, the OKB coin can be used to calculate and pay trading fees, enable users to vote and govern on the platform, and reward holders of OKB.
OKEx has been a world-leading trading platform since its 2017 launch. OKCoin is now focused on exchanging crypto for fiat, while OKEx focuses on crypto trading with an integrated API for algorithmic trading.
Let us now have a deep look into the technical analysis of OKex cryptocurrency.
Past Performance of OKB
OKB Token price found demand near the lower level of the $9 mark. Thus, resulting in an uptrend leading the price higher to the $24 mark. Moreover, the price action led to the bullish breakout of the inverted head and shoulder pattern in the daily chart.
The uptrend brings the OKB coin price closer to the 50% Fibonacci retracement level at $26. If the price manages to give closing above $26, then a bull run to $44 seems unstoppable. Moreover, the underlying bullishness is gaining enormous strength, evidenced by the last week's 50% price jump.
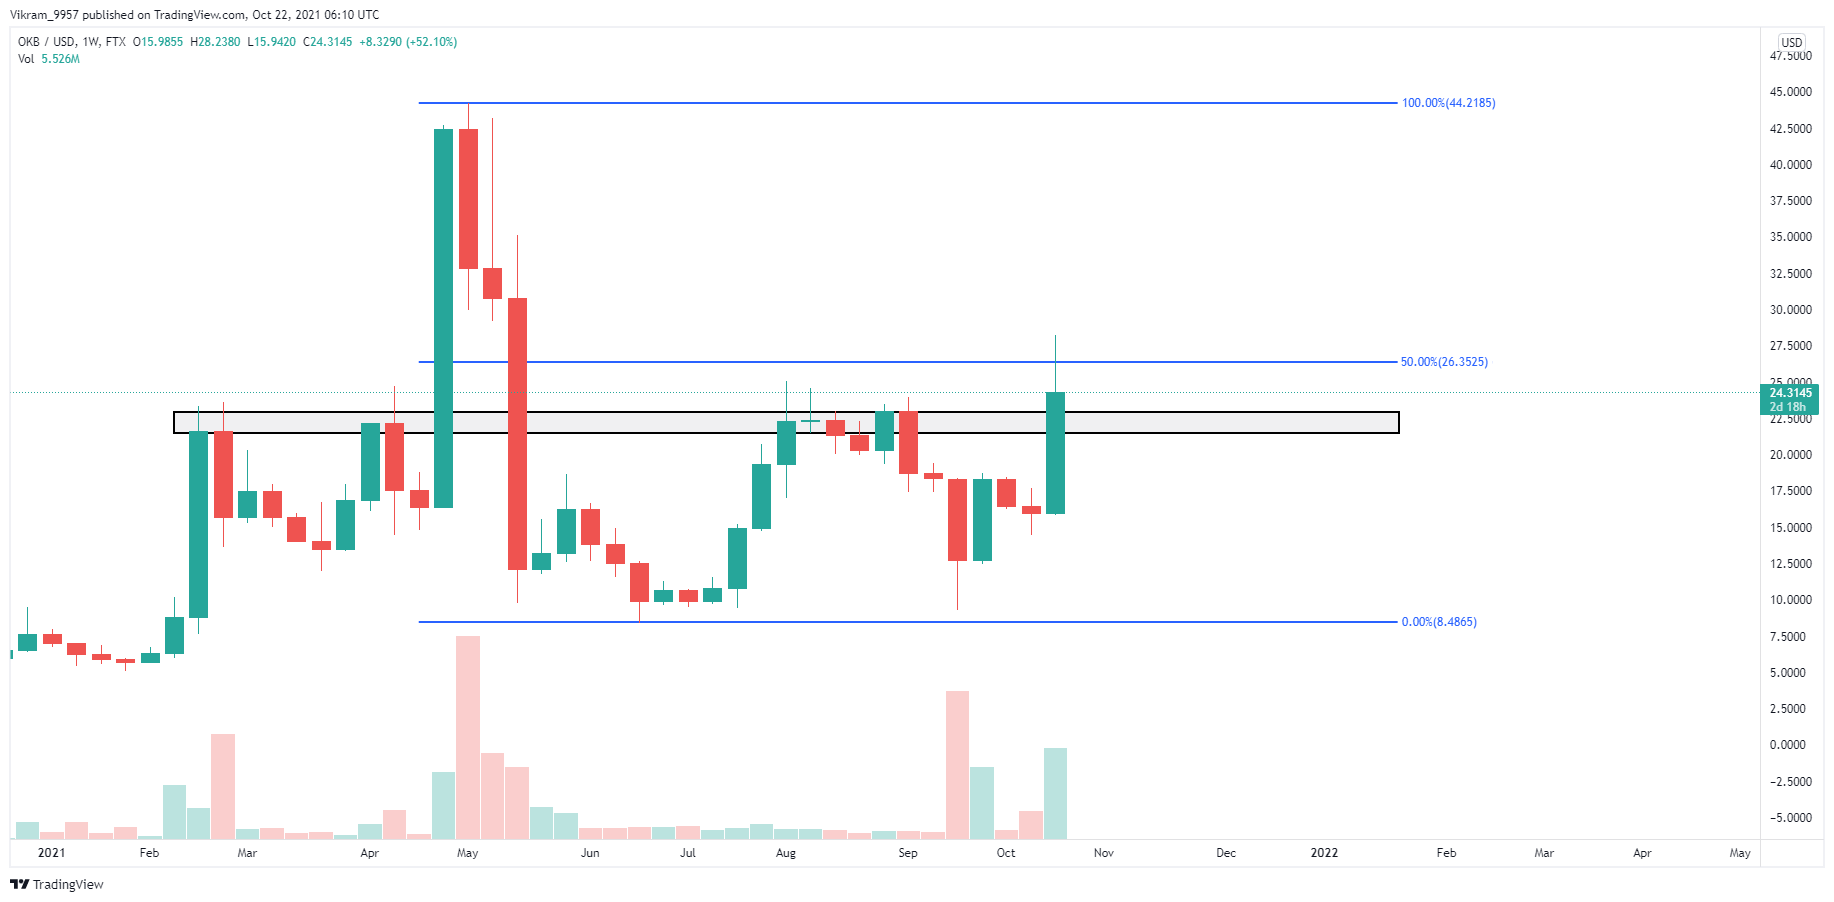
Source - Tradingview
OKB Technical Analysis
OKB cryptocurrency is currently at $24.45. Additionally, the cryptocurrency has decreased by 3.62% in the last 24 hours. Thus, projecting the short-term retracement after the bull run. Moreover, the price movement has intraday trading volume support. Hence, indicating the entry of more potential buyers.
As per the Fibonacci Retracement Levels in the daily chart, the following levels can play a crucial role. The $22 and $16 levels can provide support in case of a bearish reversal. On the upside, the levels near $30 and $36 can pose short-term obstacles.
MACD and signal lines climb above the central zero mark in the daily chart. Moreover, the lines maintain a positive alignment due to the new bullish crossover. Hence, MACD proffers a bullish signal for OKB crypto.
The RSI indicator shows a rise in underlying bullishness with the price action. Thus, the possibility of a bullish breakout increases. Furthermore, the slope of the RSI retraces from the overbought zone in the daily chart due to the short-term retracement. Hence, indicating the uptrend is strong and stable.
Upcoming Trend
As per the OKex technical analysis, the underlying bullishness of OKB crypto is increasing considerably. Suppose the price action manages to give closing above the $26 or 50% Fibonacci retracement pivot level.