Decred (DCR) is a blockchain-based cryptocurrency launched in February 2016. The Decred token and protocol were created to facilitate open governance, community interaction, and sustainable funding policies. The main driving force behind the creation of Decred is an enterprise called Company 0. Its mission is to use the capabilities of blockchain technology to create better personal data protection and to bring organizational liberty to projects. Let us look at the technical analysis of DCR.
Past Performance
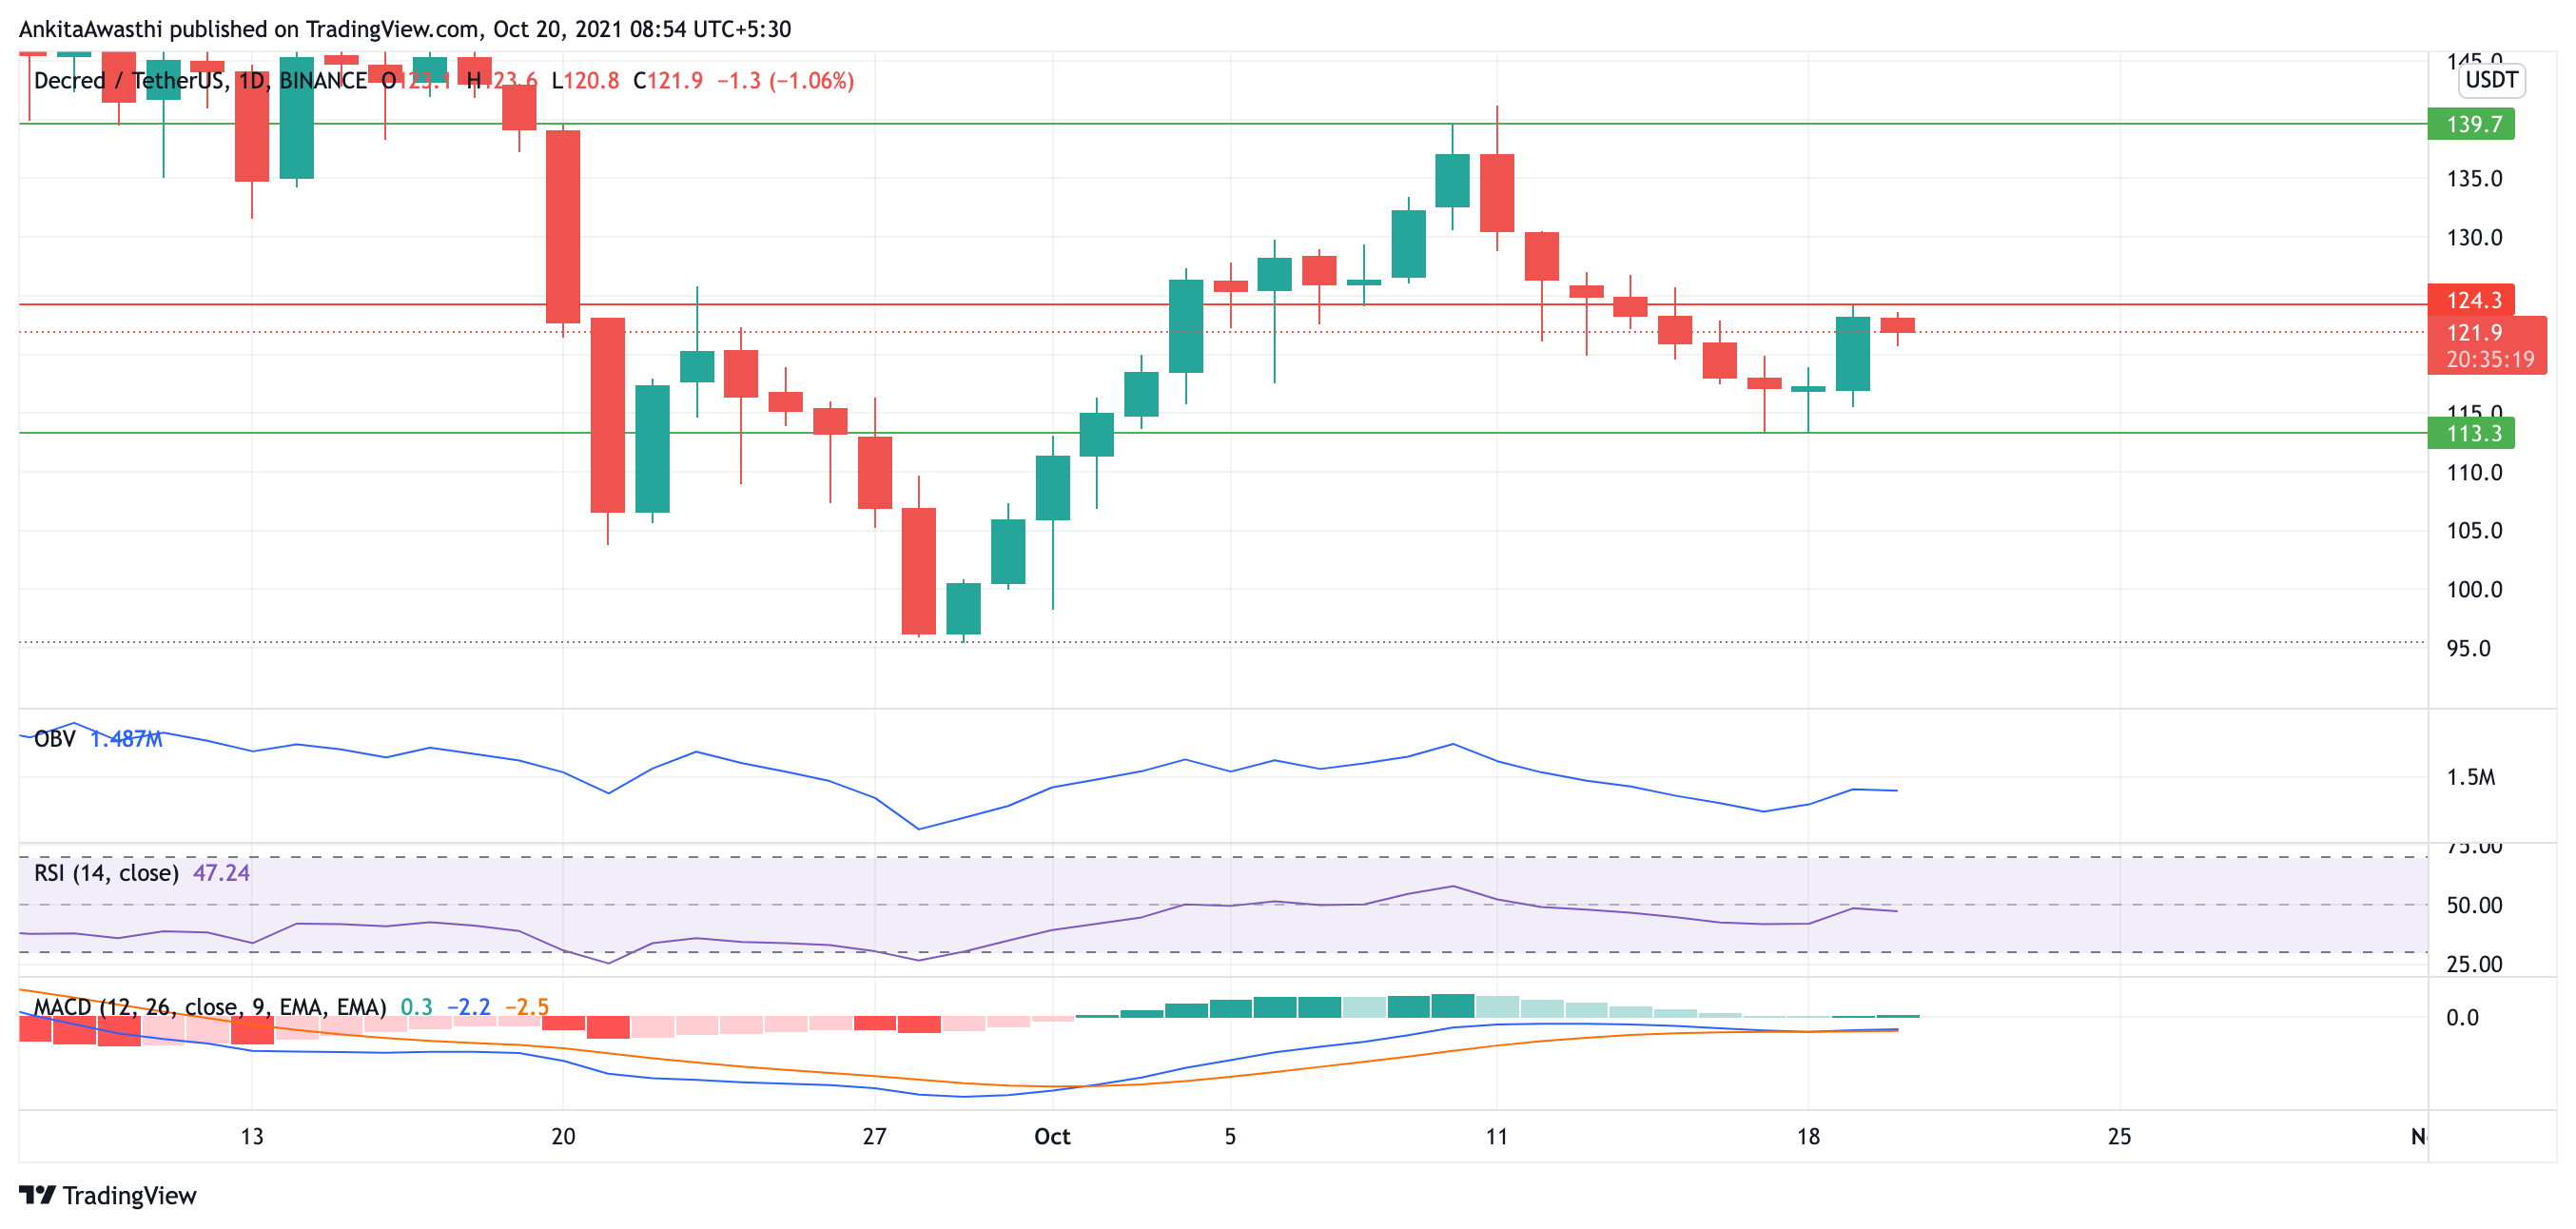
DCR opened on 13 October 2021 at $125.84. The week witnessed a downtrend and later a trend reversal. It closed on 19 October 2021 at $123.51. This was an overall change of -1.9%.
Source: https://www.tradingview.com/x/pnGbAoOR/
DCR Technical Analysis
There was a downtrend in the first part of the week. On 18 October, the trend took crucial support at $113.3 and the trend reversed itself. It is currently facing resistance at $124.3. The current trading price is $121.7 which is 1.22% down as compared to yesterday’s close.
OBV is showing a decline in the trend line, which means that the selling pressure has just started to dominate the buying pressure. This can be a negative signal, meaning that the traders may take a short position.
RSI is again showing a decline at the end of the trend. It is currently below the equilibrium at 47.24%. This can again be a negative signal, meaning that the price may go down. Traders may take a short position here. However, as the RSI is approaching the oversold region, the price may also start increasing in the coming days.
MACD is showing neutral signals as the fast and the slow lines are moving very close to each other and horizontally. There is no divergence from the price chart either.
Day-Ahead and Tomorrow
Fibonacci numbers show that the trend reversed itself before hitting the fib level at $112.96. It is currently facing resistance at the $123.74 level.
Thus, the indicators are more bearish, signaling that the traders may take a short position here. The stop loss can be placed at $113.3.