Litecoin has been struggling throughout 2019, and its price has seen on a constant decline since the start of July. Litecoin community had great hopes for the halving which took place in August, but the event failed to have an impact on the altcoin’s price.
Litecoin was trading at $53.85 at press time with a decline of 0.14% on the 24-hour price chart with a total market cap of over $3.4 billion as per CoinMarketCap.
1-Day Price Chart
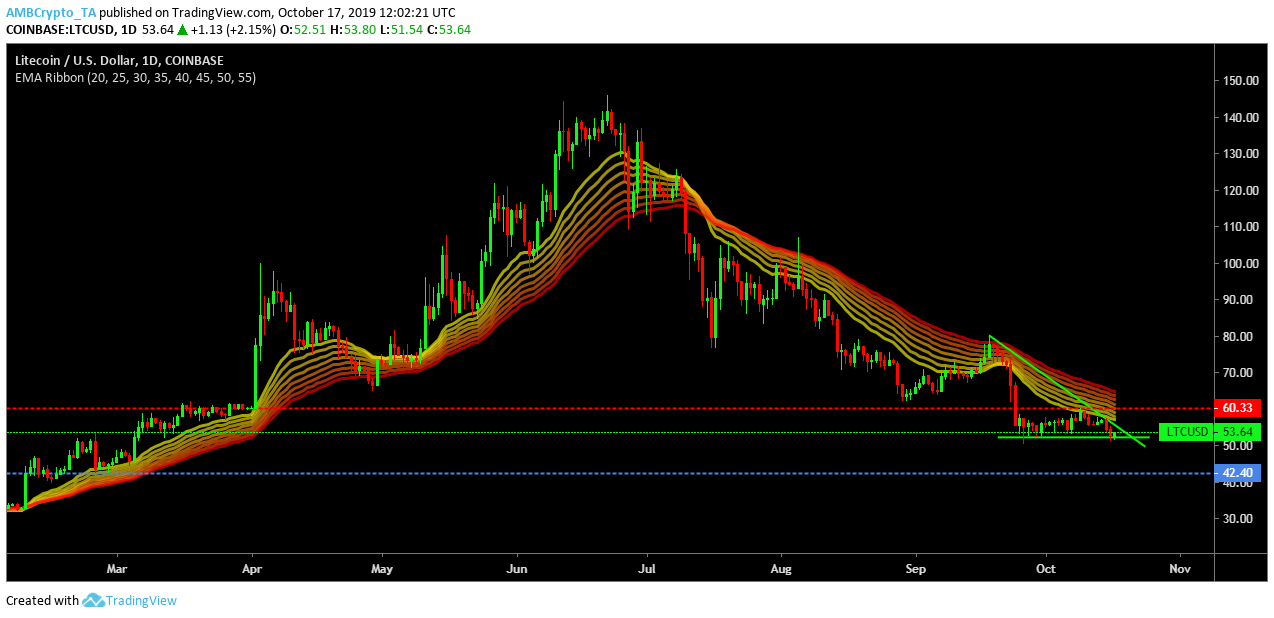
Source: LTC/USD on TradingView
Litecoin formed a descending triangle on the 1-day price chart which is considered a bearish sign as the breakout from the pattern is often downward. A descending triangle is characterized by lower highs meeting the descending channel at $79.30, $60.51 and $55.96. The base of the descending triangle remained constant at $51.72.
Ema ribbon suggested high bearish sentiment and increased volatility since the last week of September.
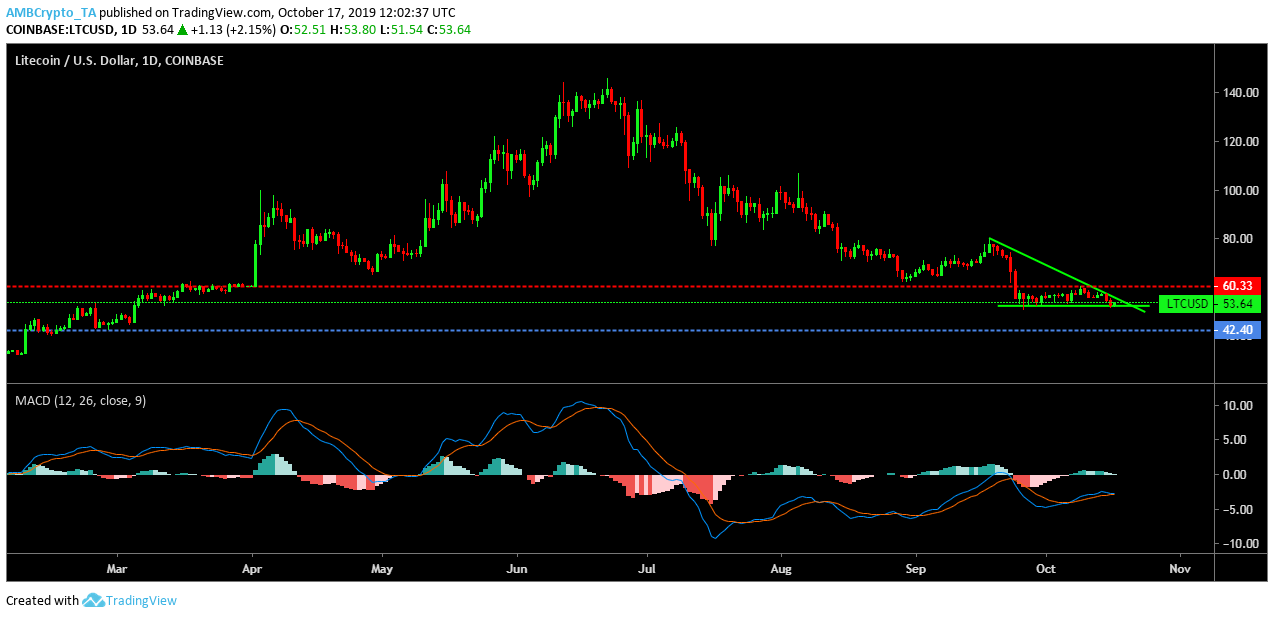
Source: LTC/USD on TradingView
MACD indicator went under a bullish crossover on 6th October, however, it looked inclined for a bearish cross over as soon as the price breaches the descending triangle. The altcoin did not have any immediate support which meant a breach from the descending triangle can slump its prices to the next support level of $42.40.
Conclusion
Litecoin’s price looked to slump further on the daily price chart as it formed a bearish descending triangle pattern, the ema-ribbon was acting as a resistant which is another bearish sign while MACD indicator also looked set for a bearish crossover in the next couple of days.