The solid support level of $14 stands firm against the huge selling pressure, keeping the chances of a bullish reversal alive for the FLOW coin price.
Flow is a Blockchain designed for mainstream adoption. It is the only blockchain to incorporate usability improvements in the protocol layer. It is being used by top developers and major brands around the globe to create new experiences using top-tier content.
Flow is home to a diverse ecosystem that includes top entertainment brands, venture-backed startups, and development studios. Global IP brands such as Warner Music, Ubisoft, and the NBA are among the ecosystem partners.
Let us now take a look at the technical analysis of FLOW cryptocurrency.
Past Performance of FLOW
FLOW price action indicates a sharp pullback to the 61.80% Fibonacci Retracement level in the daily chart. Thus, insinuating a downtrend in action.
The coin price has breached various support levels during the fall. As a result, the coin price has decreased by more than 20% in the last week.
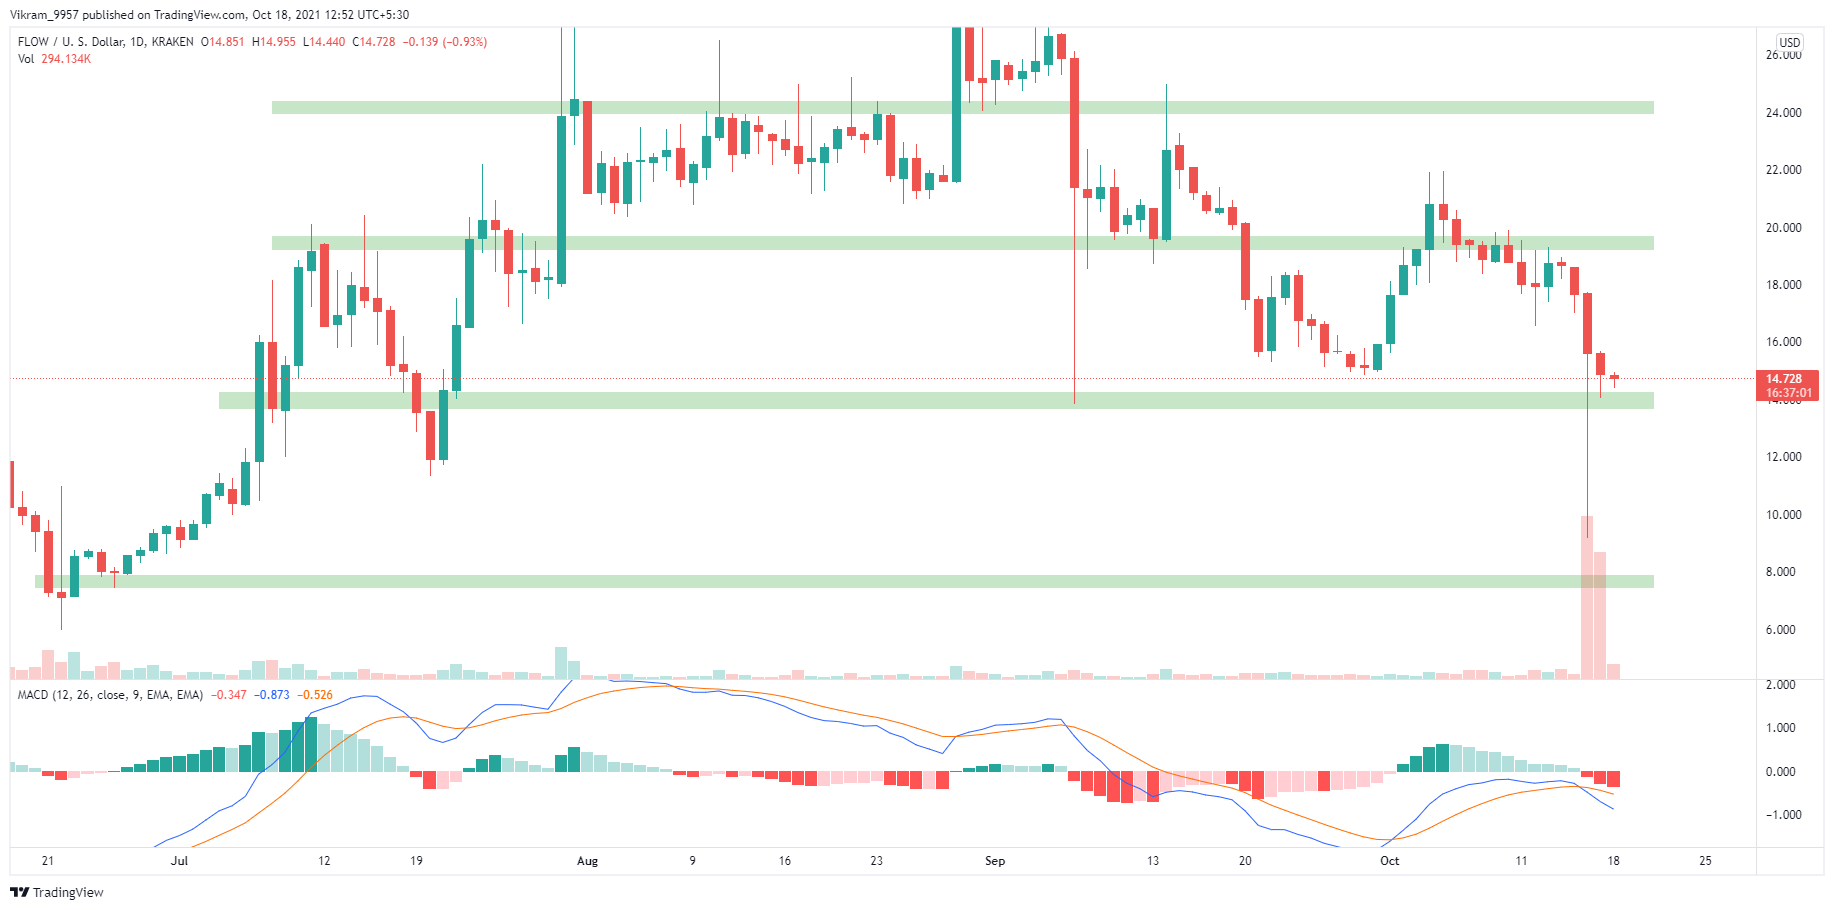
Source - Tradingview
FLOW Technical Analysis
As of writing, FLOW cryptocurrency was at $15.28. The cryptocurrency has also decreased 3.40% in the past 24 hours. However, the dramatic fall in selling pressure, evident by the decrease of 28% in intraday trading volume.
The daily chart's Pivot Points suggest that the FLOW coin price could find support at $10.75 if it falls below the $14 zone. However, if the trend conquers the bearish attack, the price could find resistance at the $19 or $24 mark.
MACD and signal lines are both below the zero line on the daily chart. Moreover, the recent bearish crossover of fast and slow lines increases the chances of a fallout. Hence, MACD generates a strong sell signal.
The RSI indicator trades fall significantly into the neutral spectrum at 33% on the daily technical chart. As a result, the slope is slightly above the oversold region. Hence, the RSI indicator projects growth in underlying bearishness.
The ADX indicator predicts a rise in price trend momentum.
Upcoming Trend
According to the FLOW technical analysis, the technical overview is highly bearish. However, the $14 support zone stands firm against the bearish attack. As a result, the chances of a bullish reversal still stand.
The levels of $14 and $19 are crucial in deciding the upcoming trend. A breakout of either level can lead to a massive move.