In a nutshell, Cosmos bills itself as a project that solves some of the “hardest problems” facing the blockchain industry. It aims to offer an antidote to “slow, expensive, unscalable and environmentally harmful” proof-of-work protocols, like those used by Bitcoin, by offering an ecosystem of connected blockchains. The co-founders of Tendermint — the gateway to the Cosmos ecosystem — were Jae Kwon, Zarko Milosevic, and Ethan Buchman. Let us look at the technical analysis of ATOM.
Past Performance
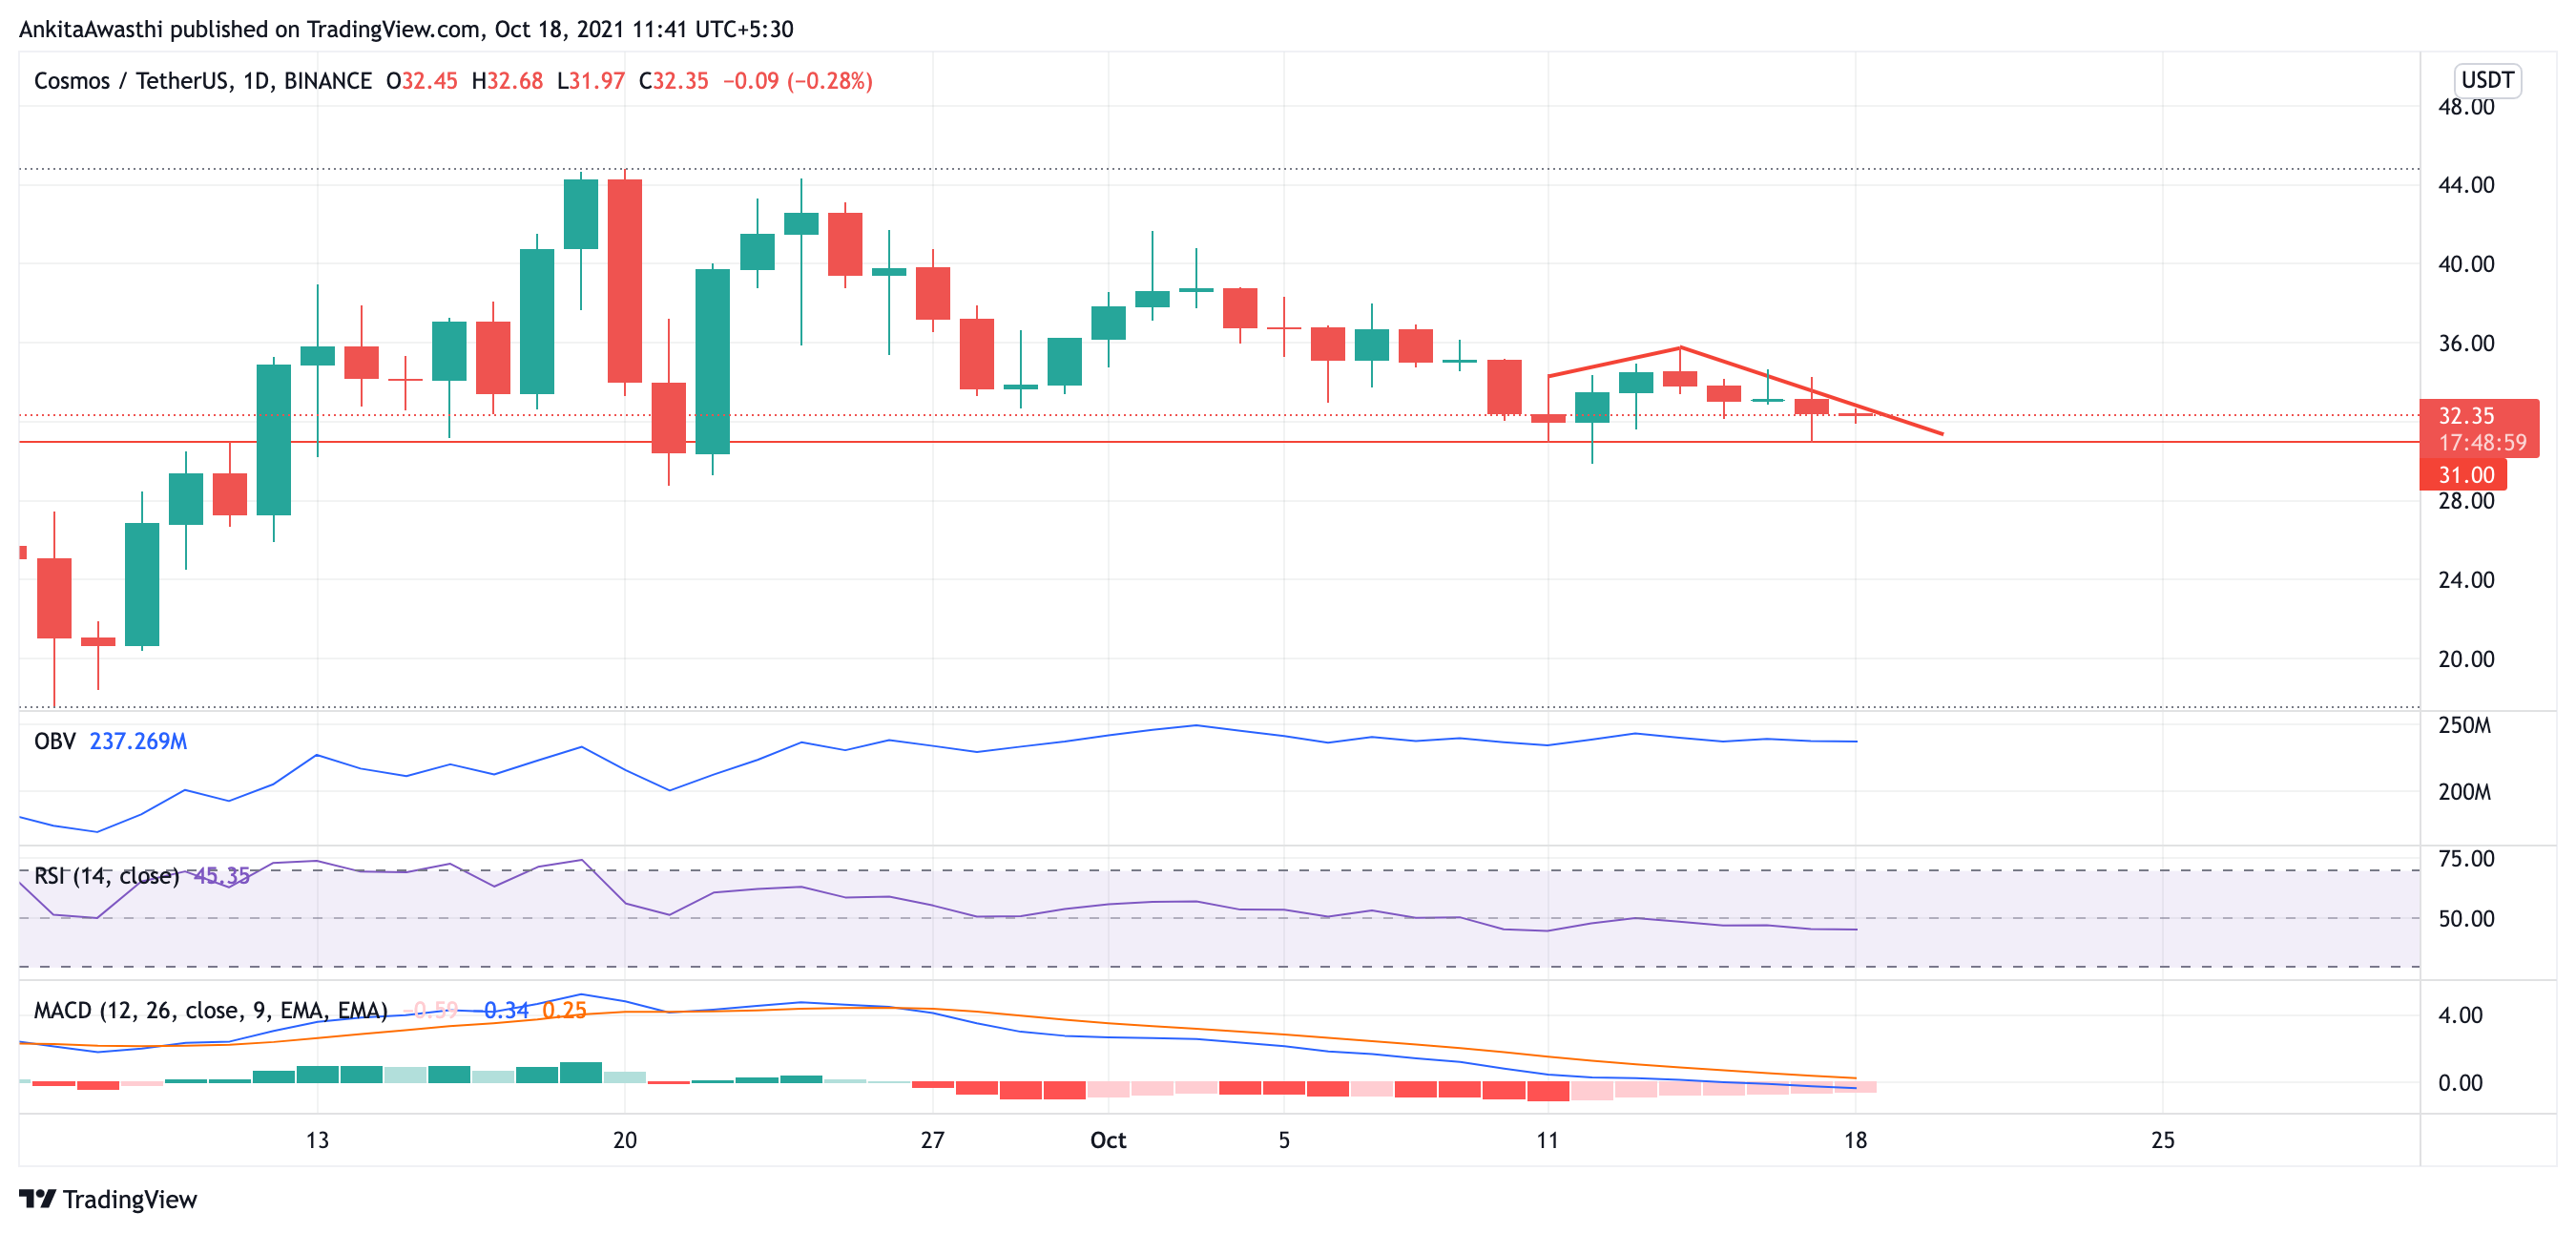
The ATOM opened at $32.46 on 11 October 2021. The week witnessed a hill on the price chart and ended on 17 October 2021 at $32.41. There was a slight change of 0.15% over the week.
Source: https://www.tradingview.com/x/EEUhX54v/
ATOM Technical Analysis
A hill was seen in the price chart across the week. The price increased up to the $35.81 level. Then the trend reversed itself, and a downtrend can be seen. The current trading price of ATOM is $32.36, which is about 0.22% down from yesterday.
OBV is showing a straight horizontal line, meaning that the buying and selling pressures are balanced. This is a neutral signal. The traders may hold their current position.
RSI is currently at 45.38%. It is on a downtrend, which is a bearish signal. The ATOM traders may take a short position here if the price drops below the support at $31.
MACD is showing that the fast line is moving below the slow line, but the gap between them is reducing. However, both are heading in a negative direction. There is no divergence from the price chart. This is a bearish signal and traders may take a short position here.
Day-Ahead Tomorrow
Fib retracement shows that the ATOM price has gone below the Fibonacci level at $32.33. This is a bearish signal and if the price continues to decline, then the next fib support will be tested at $28.83.
Thus, the indicators are more on the bearish side. The traders may take a short position by keeping the stop-loss at $31.