Flow was officially released in 2019. Earlier it was named Axiom Zen, which was changed when the creator Dapper Labs raised their first funding. Flow is basically a platform for playing games and trading gaming tokens. Let us look at the technical analysis of FLOW.
Past Performance
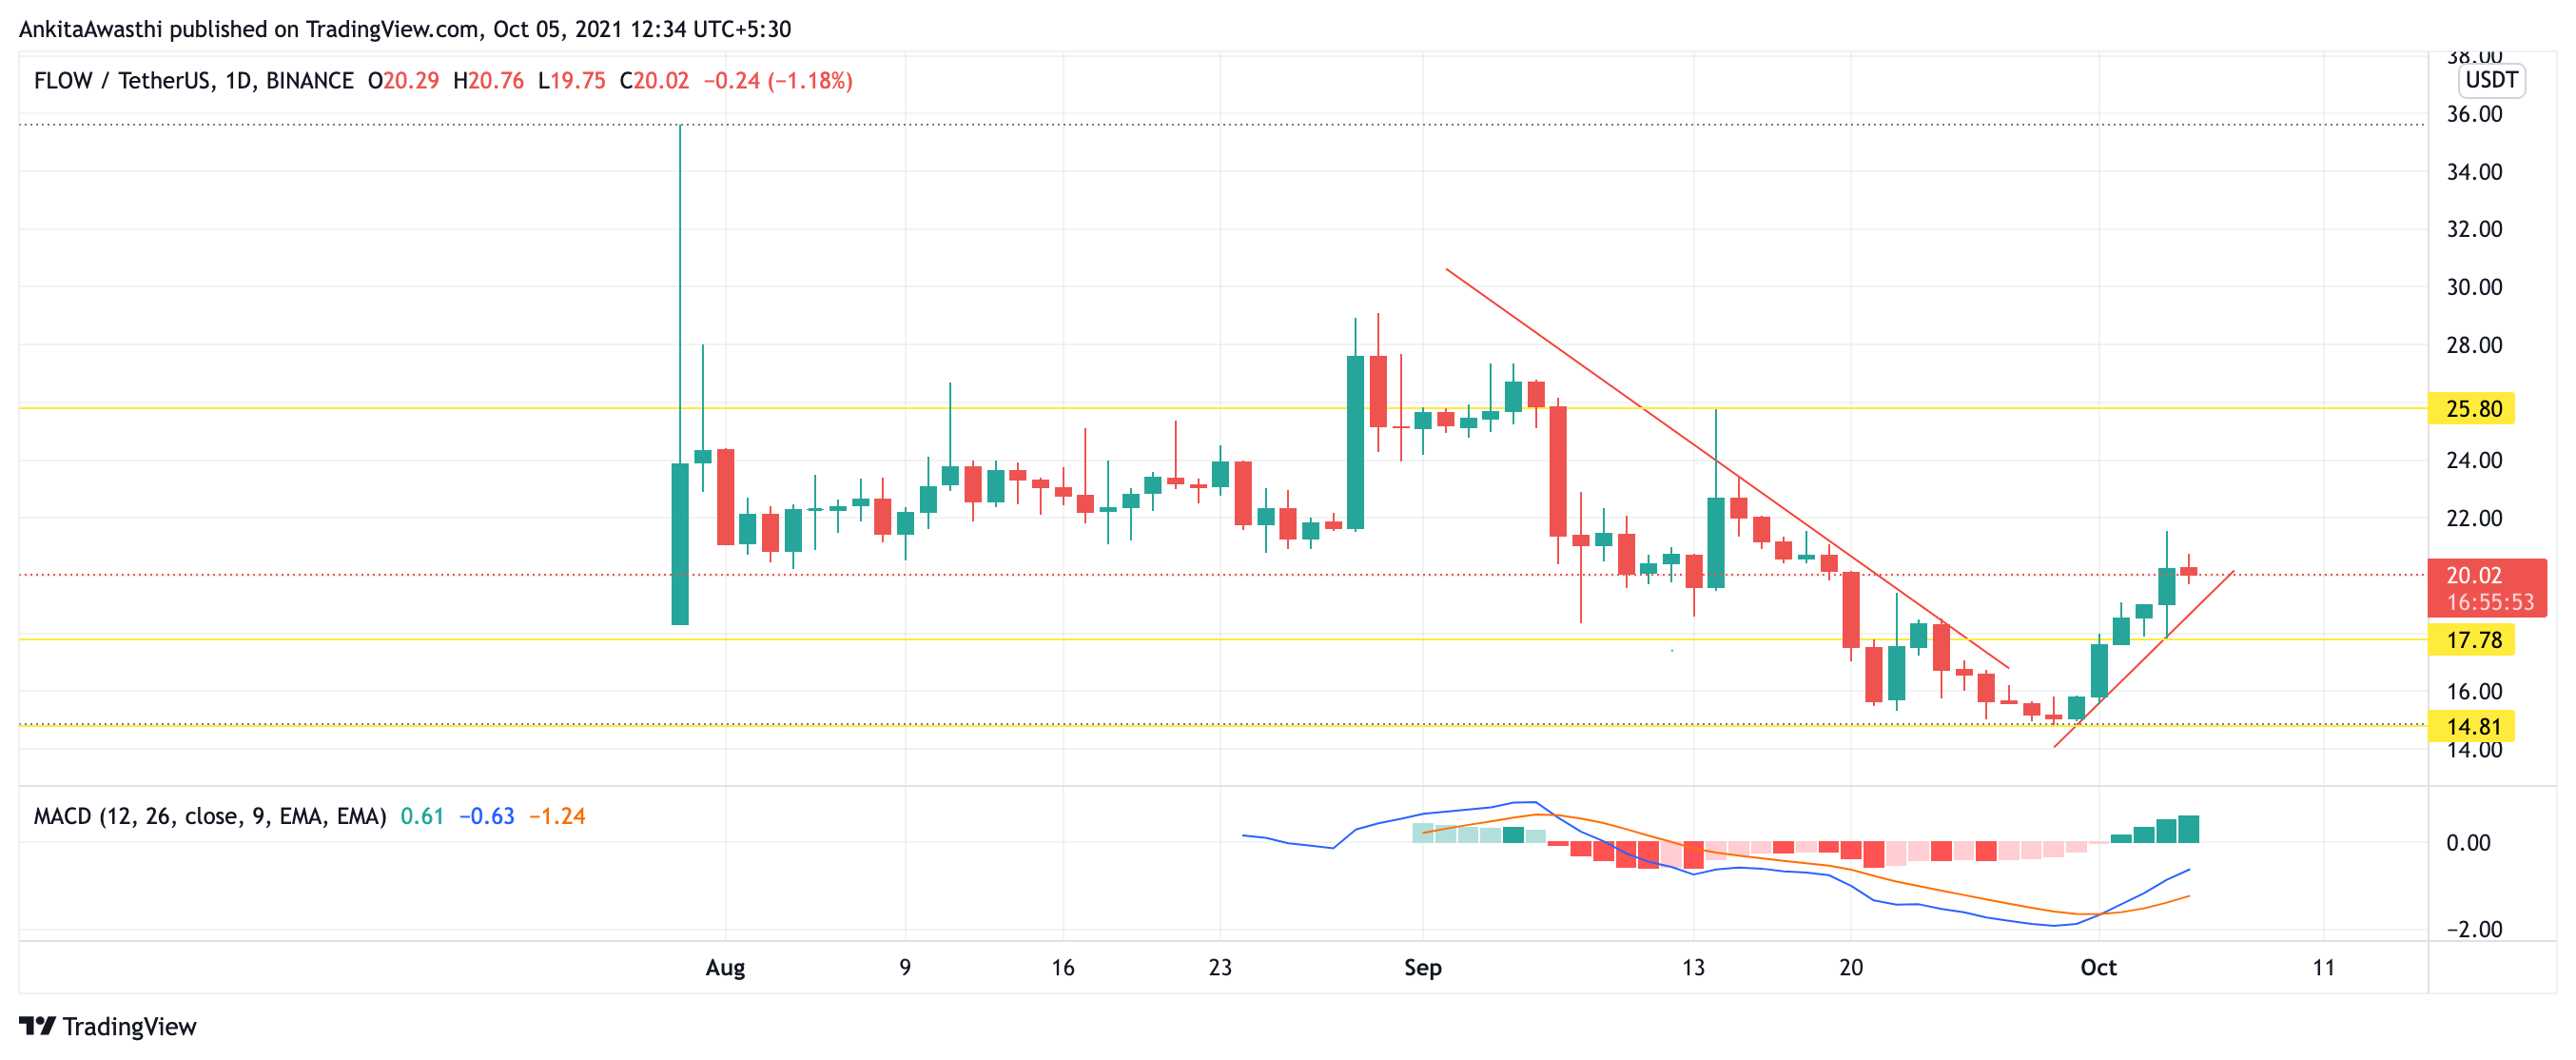
In the past week, Flow opened at $15.64 on 28 September 2021. The price was in an uptrend over the entire week. Flow finally closed at $20.48 on October 4, 2021.
Source: https://www.tradingview.com/x/H9uTFOnr/
Flow Technical analysis
The FLOW price was on a continuous downtrend from the beginning of the previous month. It came down to a low of $14.85 and took the support from there to reverse the trend. This signals that it will be a good time to take a long position if the price remains above the support level of $20 for more than 24 hours.
If the price sustains above the support level, we can see a bounce in the price, and it can test the resistance level at $25.80.
Currently, Flow is trading at $20.15, which is approximately 0.64% down. This can be seen as a usual daily fluctuation as the overall trend is still positive.
OBV can also be seen as constantly increasing over the last few days. This signals that the buying pressure is higher. Hence, it is time to take a long position but keep looking for the trend to hit the resistance level of $25.80.
RSI says no different about Flow. RSI has been constantly rising in the past week and is currently at 55.76%. It is expected to rise even further, and hence this is a good time to enter the market or to take a long position.
MACD, being a lagging indicator, is still in the negative region due to the past month’s downtrend, but the last line’s takeover signals a buying point. There is no divergence of MACD with the prices chart. Hence, it is unlikely for a trend reversal to be seen in the coming days.
Thus, all the indicators are strongly towards the positive side and hence traders may take a long position but keep track to check the RSI to hit the overbought level, which may contribute to reversing the trend. Or if the sellers overtake the buyers in the market.
Day-Ahead and Tomorrow
Higher highs and higher lows have been seen in FLOW from the last few days. Fib retracement indicates that there was a 0% change when the trend reversed itself for a positive direction. Since the trend is continuing and there are strong bullish signals, traders can take a position with a $25.80 target and stop-loss at a $17.63 level.
However, if the selling pressure overpowers the buying pressure, the price can break down from its immediate support level, which is at $19.62. A breakdown will highlight the next support level, which is at $18.61. Traders can take a short position accordingly by keeping the stop-loss at $21.