REN is a great protocol that is used to bring Bitcoin into Defi space. Those who believe in DeFi and only hold bitcoin should consider having RevN’s protocol that allows you to use your digital assets in DeFi space. Let us look at the technical analysis of REN.
Past Performance
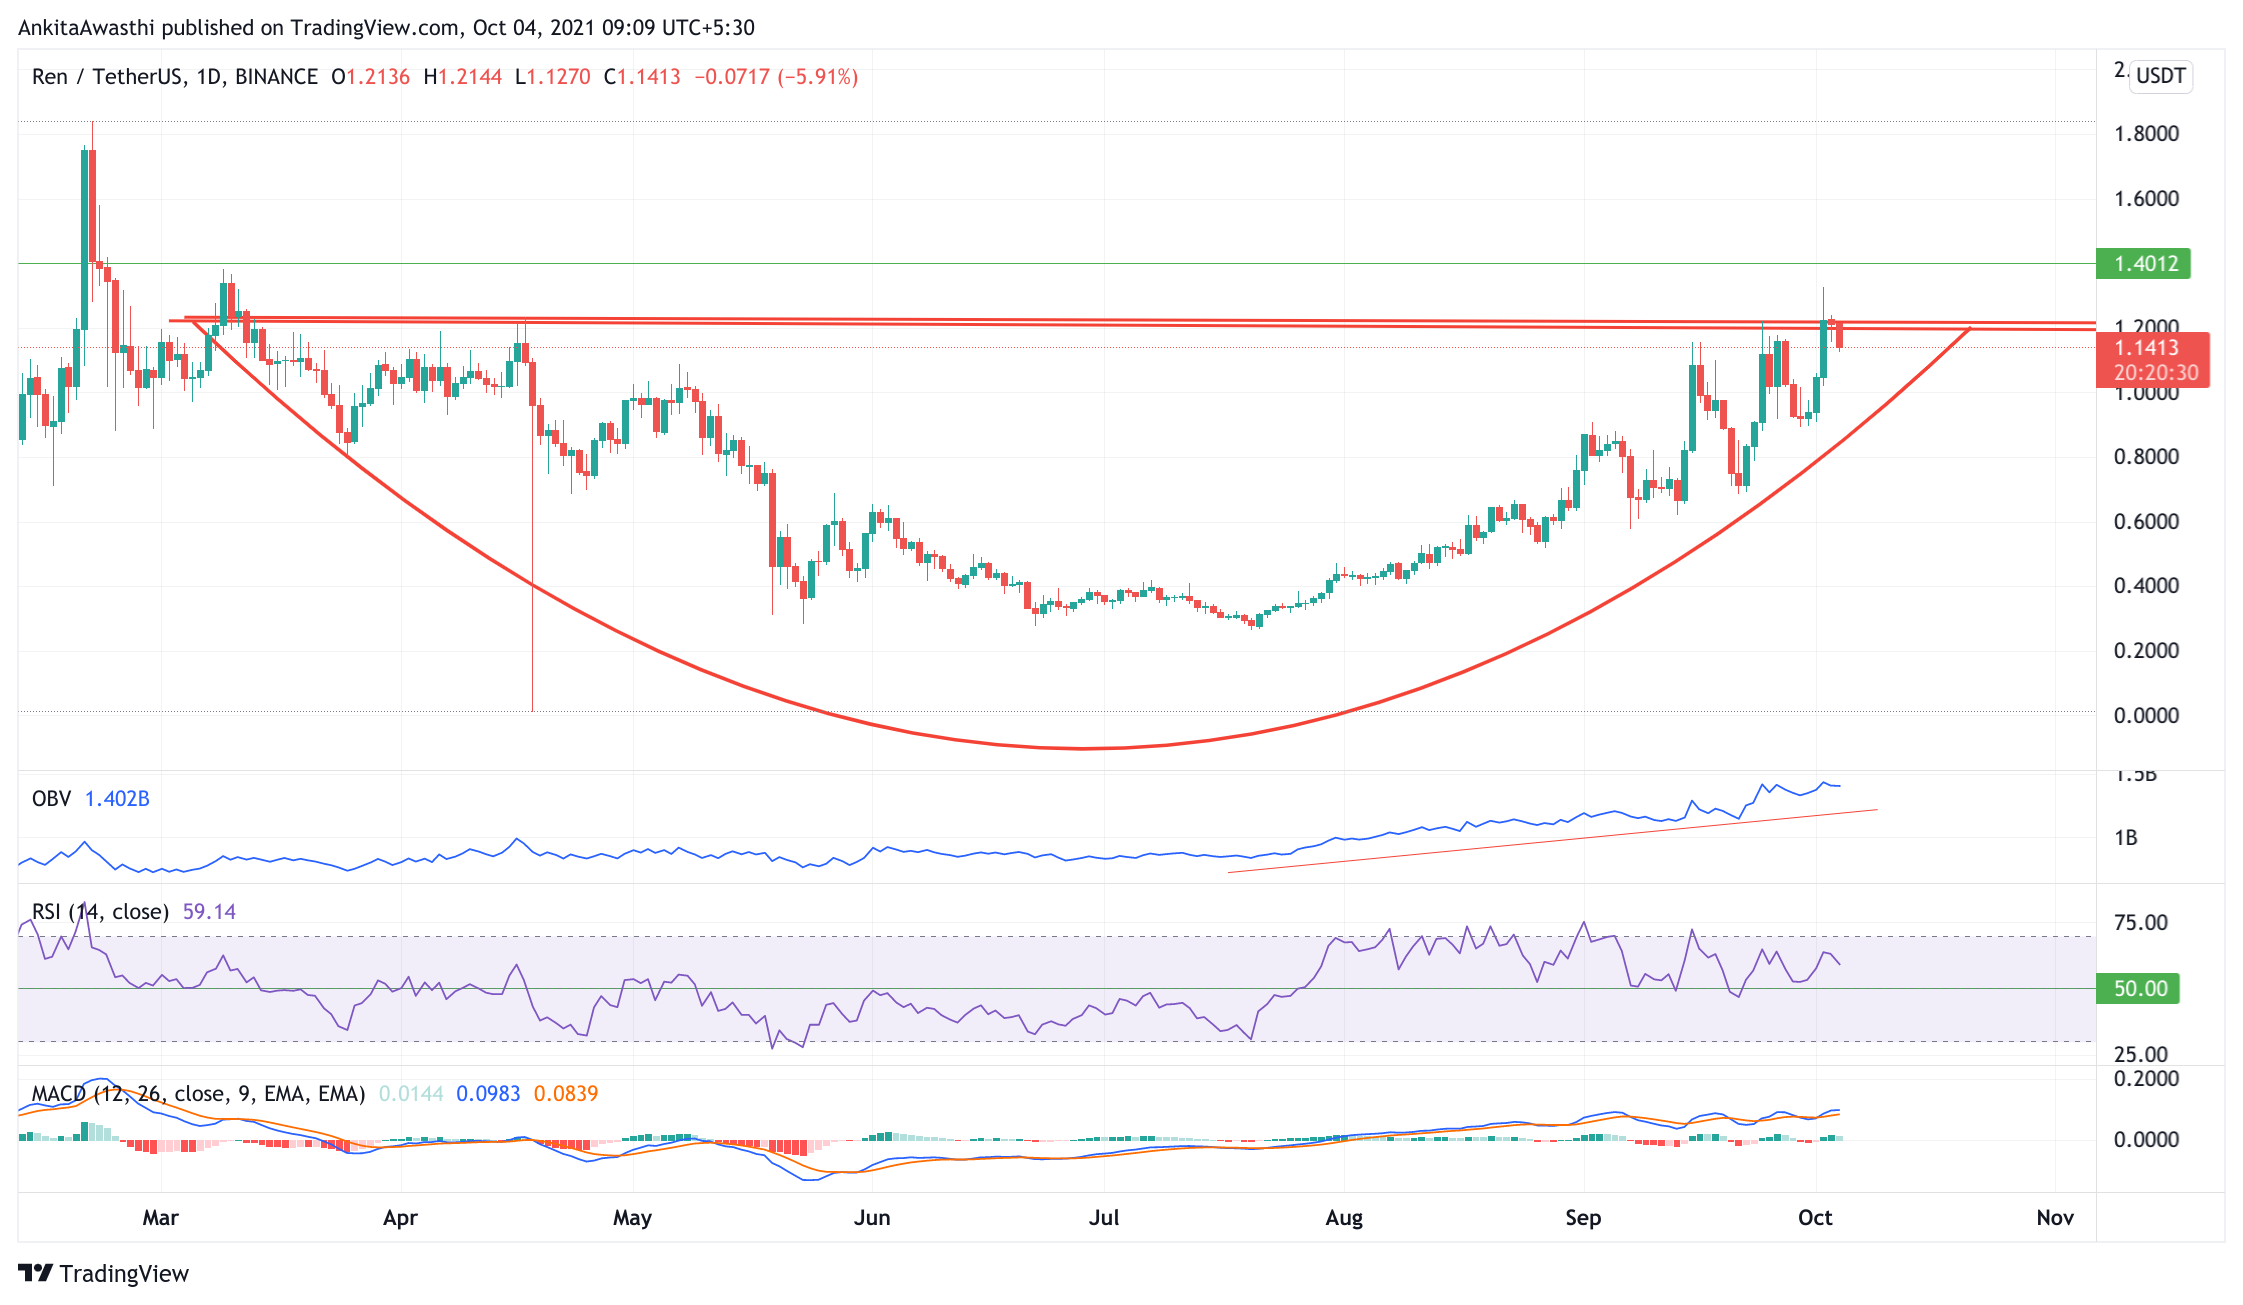
On September 27, 2021, REN opened at $1.16. On October 3, 2021, REN closed at $1.21. Thus, in the past week, the REN price has increased by approximately 4.31%. In the last 24 hours, REN has traded between $1.13 -$1.24.
https://www.tradingview.com/x/R00AOEwh/
REN Technical Analysis
After the 18th April market correction, the price has been consolidating. After consolidation of over 2 months, REN broke out of $1.12 levels making a higher high and higher low. Thus, the market momentum seems bullish. Let us see what the indicators are indicating:
At the time of writing, REN is trading at $1.14. The price has decreased by approximately 5% from the day’s opening price. Thus, indicating a bearish day ahead.
The MACD is currently above the zero range. Moreover, we can witness a bullish crossover by the Signal line over the MACD line. Therefore, we can expect the price to gain momentum and rise.
Talking about the RSI indicator. It is at the 59% mark. It is constantly facing rejection at the 63% mark, which is acting as a strong resistance level. However, it is making a bearish divergence. Thus, selling pressures are slowly mounting. We have to wait and watch if selling pressures become strong enough to bring about a fresh breakdown from the support zone.
The OBV indicator has broken its uptrend and has started rallying in an opposite direction.
In short, when we look at oscillators, we can say that the price may continue to fall for the rest of the day. However, we cannot rule out the possibility of a trend reversal.
Day Ahead And Tomorrow
Currently, it is trading below the second Fibonacci pivot point of $1.22. If the bears remain strong till day end, then the price is likely to rise above the FIB resistance levels. A breakdown from this zone will highlight the next support level at $1.07. Traders can take a short position accordingly.
On the upside, if the price breaks the resistance level of $1.37, then we can expect a strong up movement in the price. It will highlight the next resistance level of $1.44.