Algorand is a pure proof-of-stake blockchain protocol that is permissionless. Contrary to proof-of-work (PoW), where the root block must first be validated using computing power, the Algorand blockchain uses a pure proof-of-stake approach. All validators are only required to agree on the subsequent blocks to create a new one.
Algorand's blockchain was created when 10 billion ALGO were minted. As a result, the distribution of the immutable and fixed 10 billion ALGO tokens will cease in 2030 rather than 2024 as initially planned.
Let us now look at the technical analysis of Algorand cryptocurrency.
Past Performance of Algorand
Since September 24th, ALGO coin prices have been trending lower due to the increase in selling pressure. By forming lower lows under the strong bearish influence. Thus, generating a resistance trend line. However, the coin price approaches the support zone near the $1.5 mark. The breakout of the support zone or the resistance trend line will decide the upcoming trend.
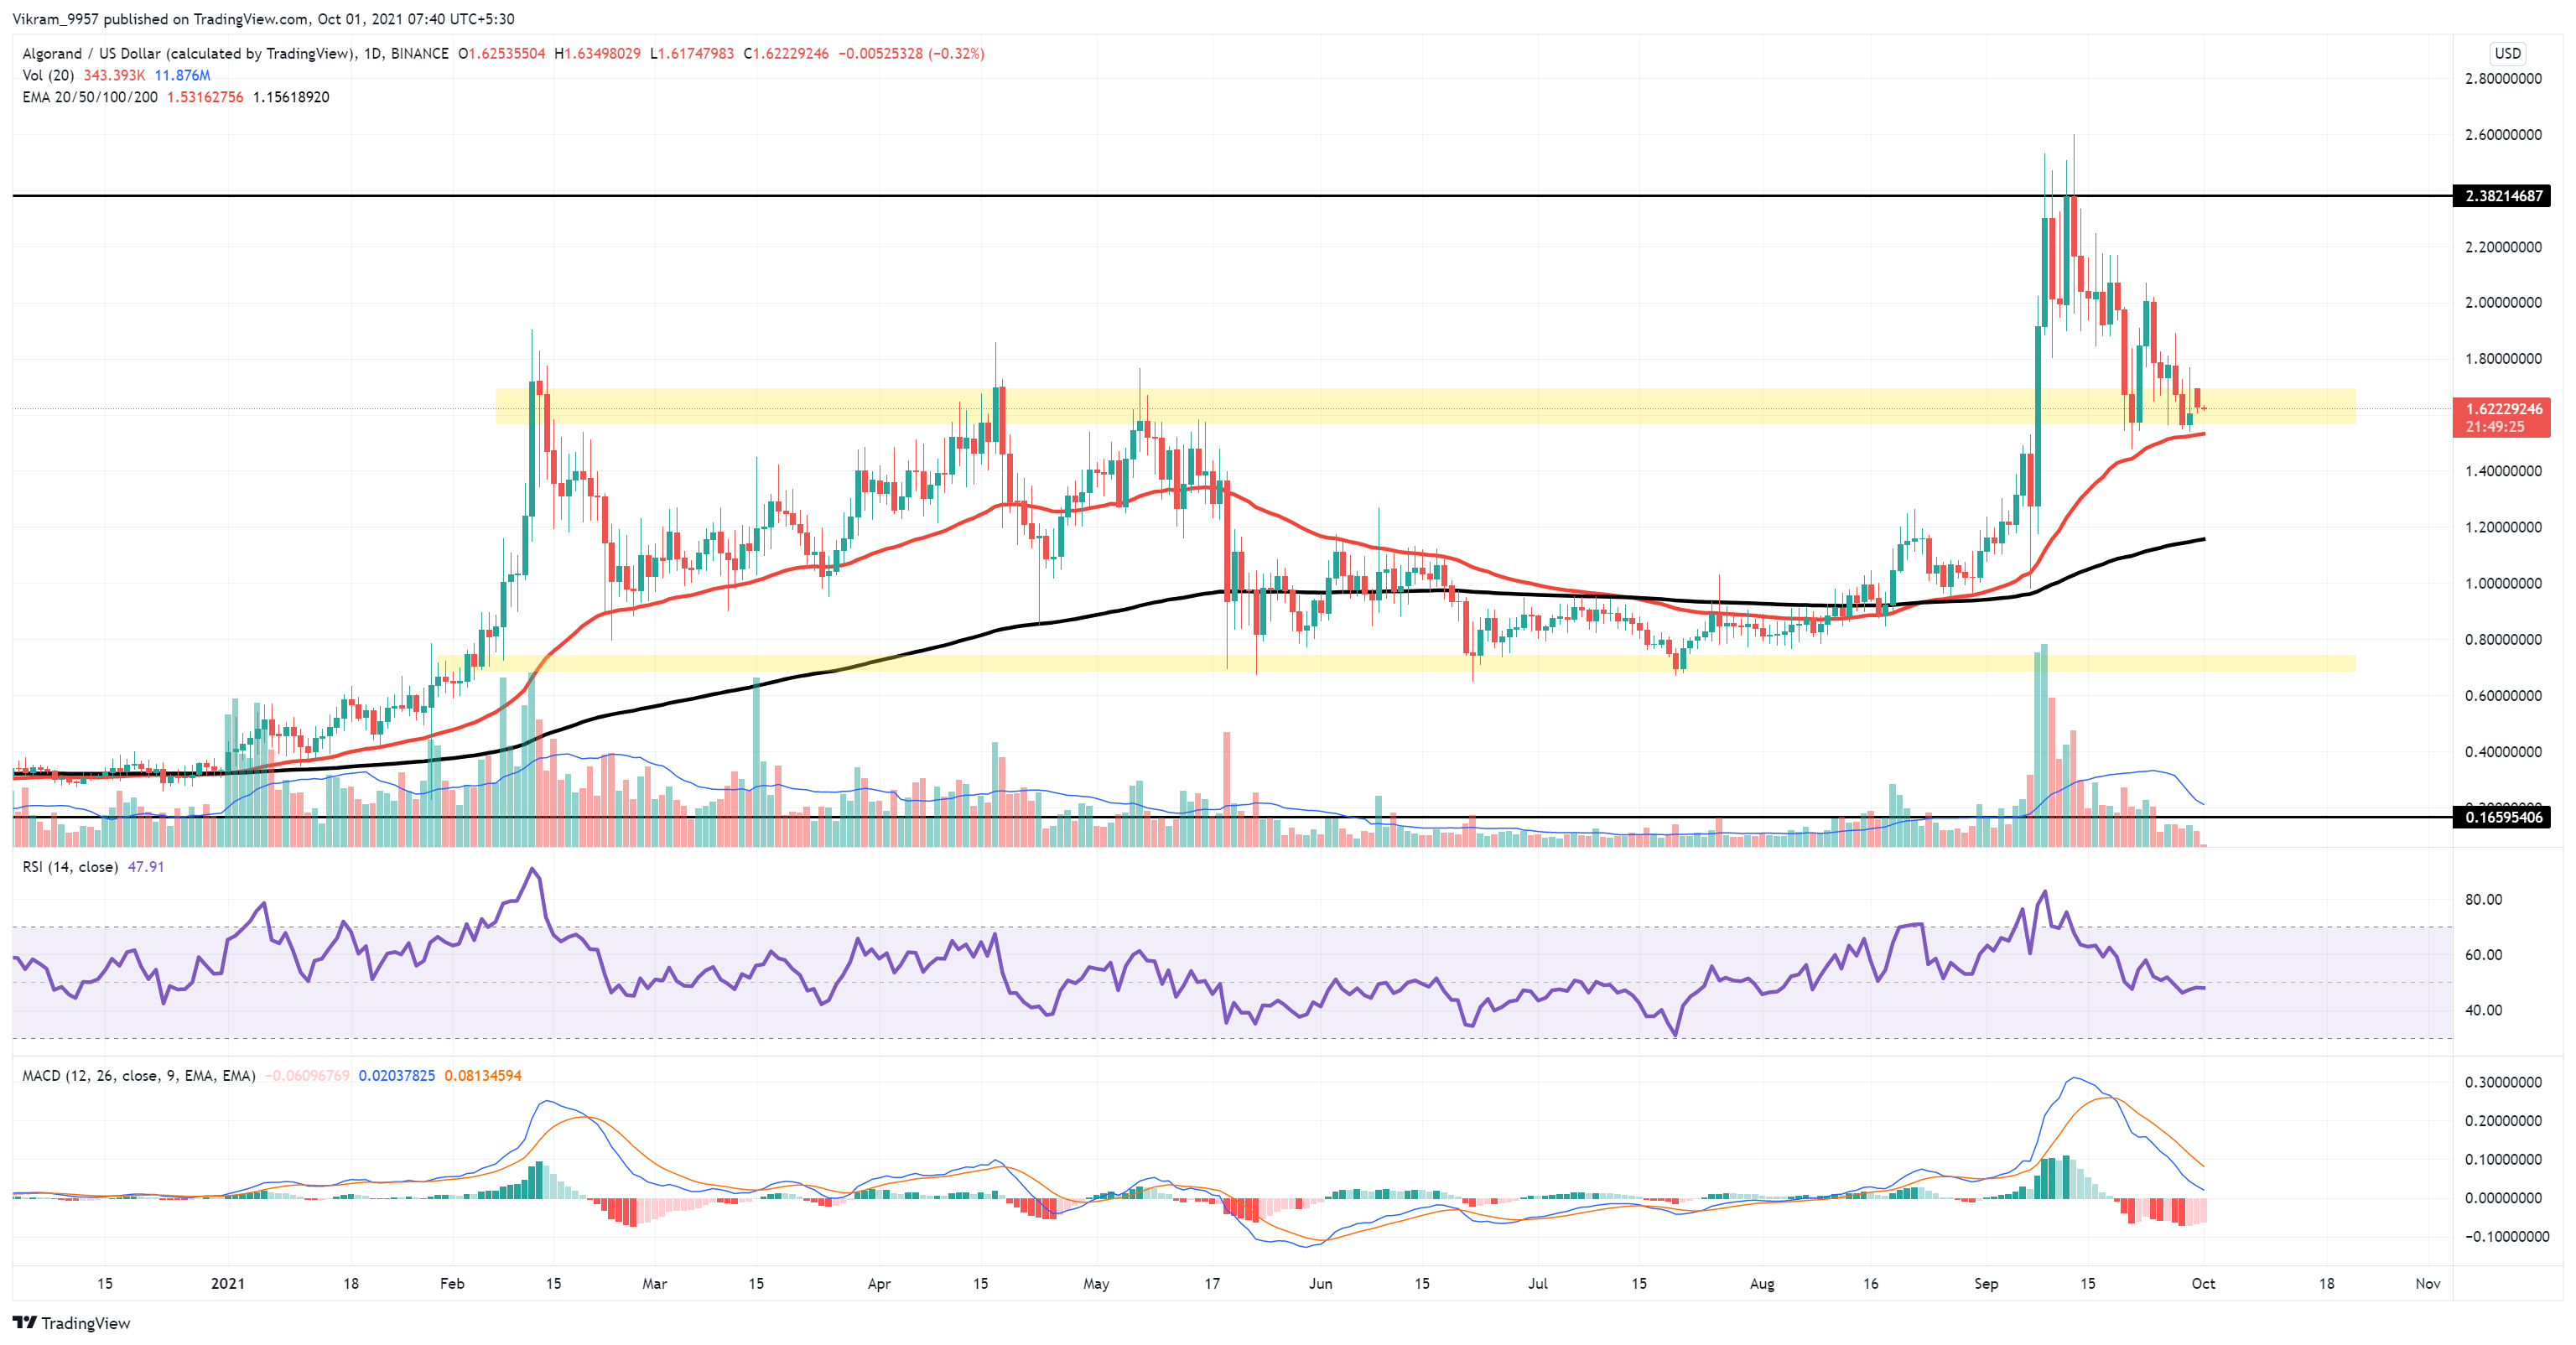
Source - Tradingview
ALGO Technical Analysis
At the time of writing, ALGO cryptocurrency is at $1.63. Additionally, it has experienced a fall of 1.17% since the opening. Thus, resulting in a bearish candle formation.
The push from the $1.5 support zone can result in a bullish reversal or even a bullish breakout of the trend line. Thus, resulting in a possible up move of more than 40%. However, a breakout below the $1.5 support zone can result in a bearish downfall of about 30%.
The RSI slope approaches the central line. The slope moves sideways after the recent fall from the overbought boundary at 70%. The RSI trend is still a downside, but the central line might provide some bullish assistance.
ALGO crypto trades above the crucial Exponential Moving Averages on the daily chart. Furthermore, the 50-day EMA provides support to the falling prices near the support zone.
The MACD and signal lines are falling towards the zero mark on the daily chart. The lines maintain a bearish alignment. The bearish histograms sustain their strength. Thus, indicating a sell signal.
Upcoming Trend
Algorand's technical analysis indicates that the ALGO token is at a very crucial stage. The support zone and the resistance trendline make a triangle in the daily chart. The breakout of either will decide the future trend. Investors must be cautious and avoid giving into FOMO.